Fall or Spring? Ten Years of Jamaica Plain Condo Sales Answer the Timing Question
Every August we field the same question from Jamaica Plain condo owners: list now and try to catch buyers before the holidays, or hold off until spring? It's a fair question, and the usual answer — "spring is the best market" — gets repeated so often that nobody bothers to check it.
So we checked it. We pulled every closed condo sale in Jamaica Plain going back to 2016 and split each year into two halves: closings from January through June, and closings from July through December. Then we compared them on the four things a seller actually cares about — median price, price per square foot, days on market before an accepted offer, and sale price as a percentage of list price.
Three of those four told a mixed or muddy story. One of them didn't.
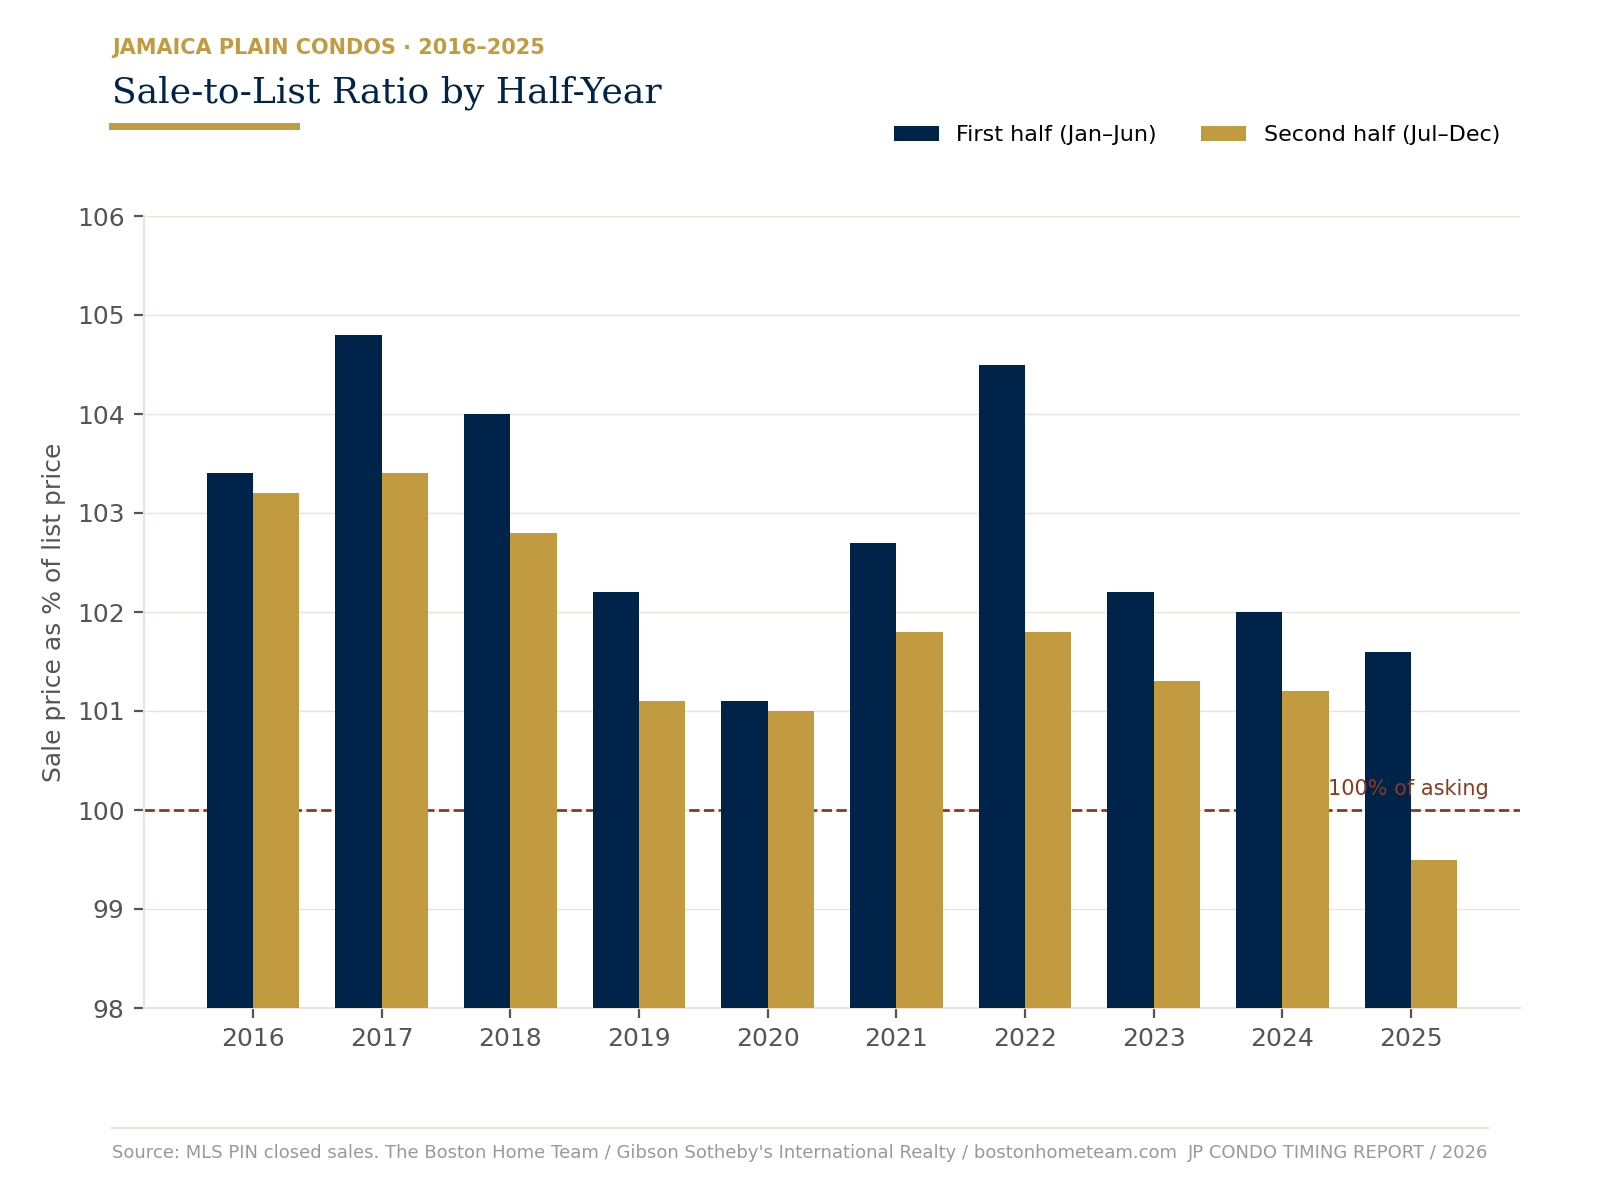
Sale-to-list ratio sounds like an industry statistic until you translate it. On a Jamaica Plain condo listed at $775,000, that average gap of 1.1 percentage points is about $8,500. That's money that disappears not because your condo is worth less in October, but because you are negotiating against a thinner, less urgent pool of buyers.
Above-asking offers are a competition phenomenon. They happen when two or more buyers want the same unit in the same week. Spring produces that condition far more reliably than fall does — and the ratio is simply the scoreboard.
The 2025 half-year figures are worth pausing on. In the first half of last year, Jamaica Plain condos sold at an average of 101.6% of asking — above list. In the second half, that fell to 99.5%. That was the first and only half-year in the last ten where the neighborhood averaged below asking price.
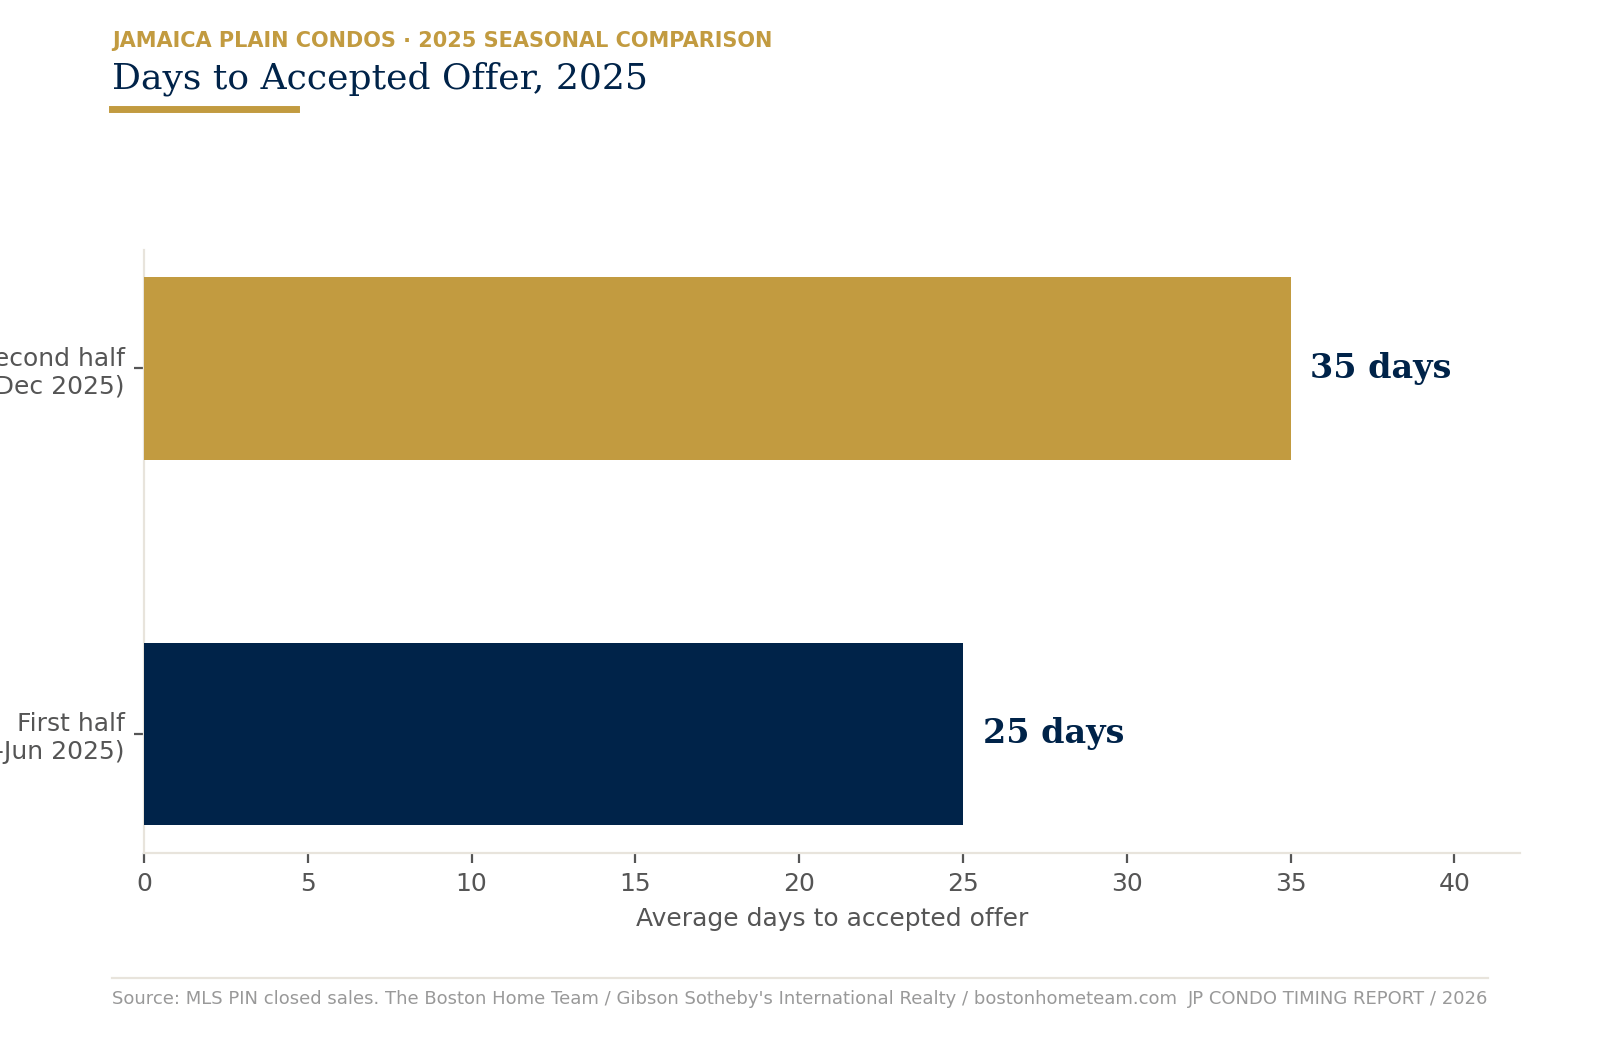
Time on market moved the same direction. The average Jamaica Plain condo took about 25 days to secure an accepted offer in the first half of 2025. In the second half, it took 35 days. Ten extra days of showings, weekend open houses, and second-guessing your price.
One year isn't a trend. But it's the most recent year, it's the most extreme reading in the dataset, and it points the same way the previous nine do.
Here's the part that surprises sellers, and the reason we don't lead with price when we make this argument. Median sale price was higher in the second half of the year in five of the last ten years. As a seasonal price signal, that's noise.
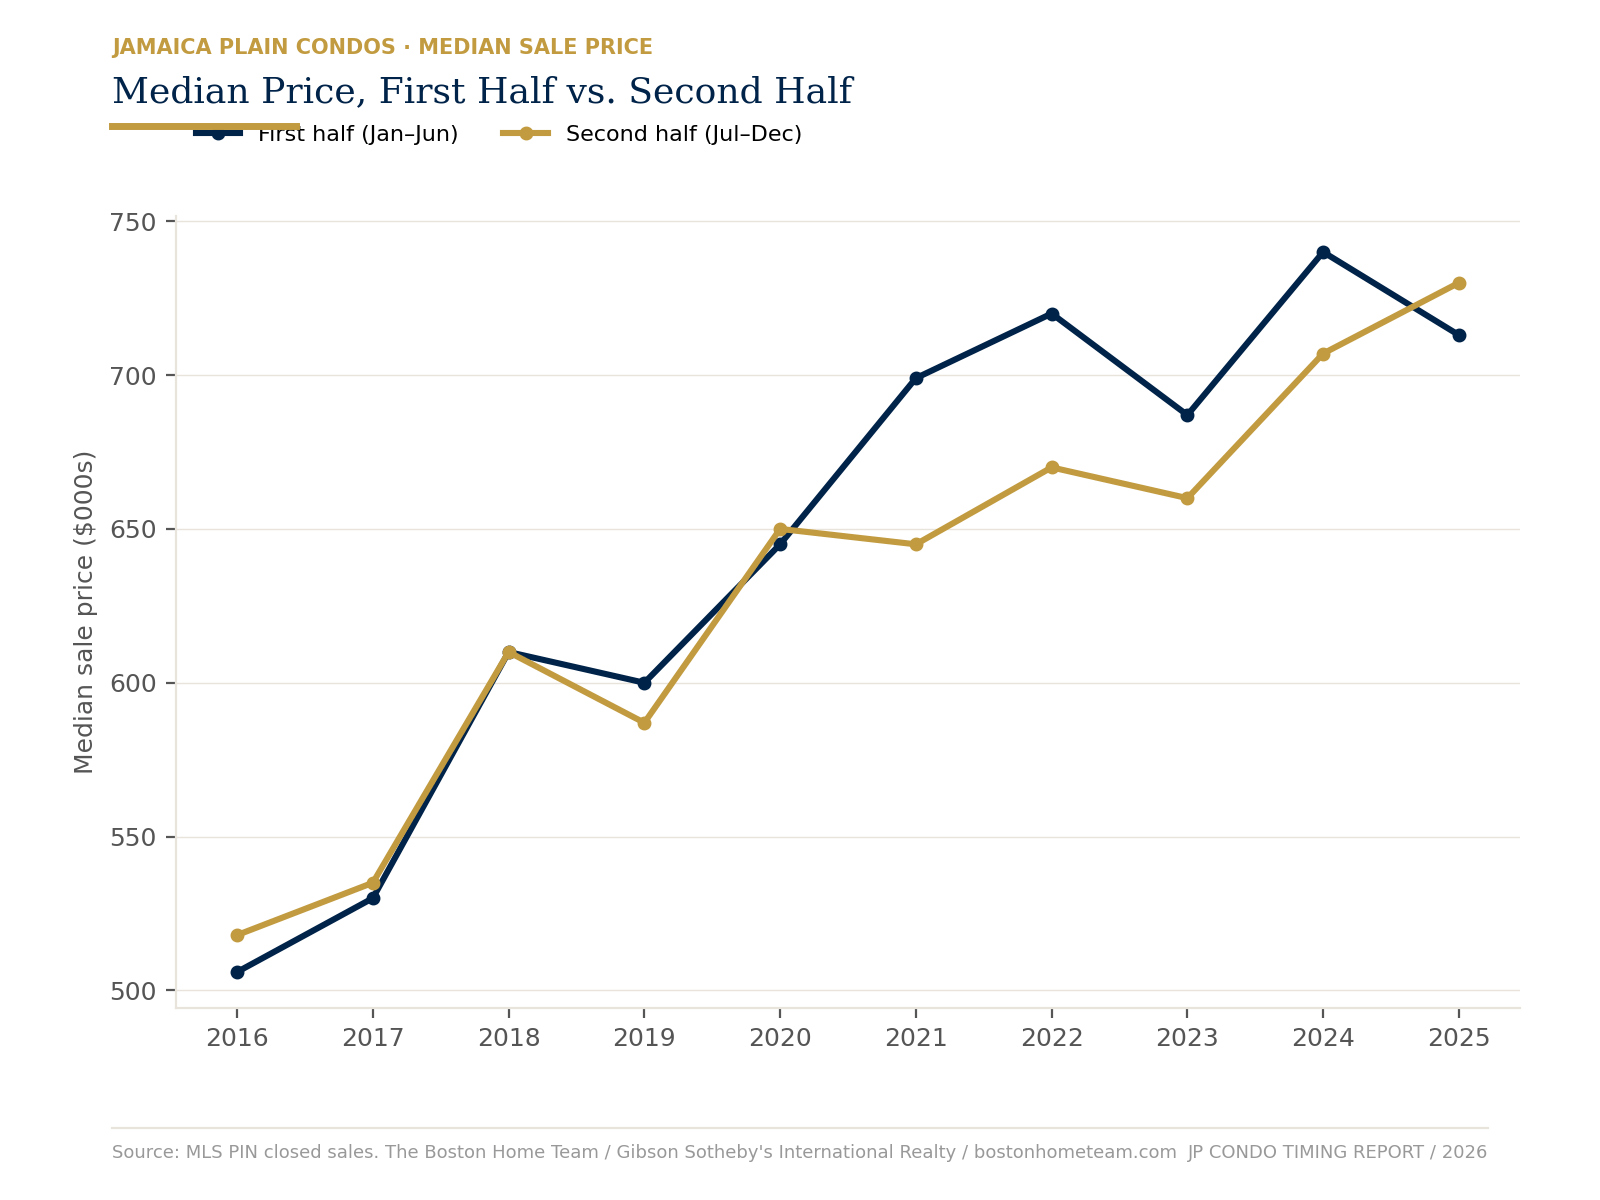
Year | Median, H1 | Median, H2 | Change | $/sq.ft., H1 | $/sq.ft., H2 |
|---|---|---|---|---|---|
2016 | $506K | $518K | +2.4% | $456 | $474 |
2017 | $530K | $535K | +1.0% | $497 | $488 |
2018 | $610K | $610K | 0.0% | $525 | $518 |
2019 | $600K | $587K | −2.3% | $538 | $528 |
2020 | $645K | $650K | +0.8% | $578 | $567 |
2021 | $699K | $645K | −7.7% | $588 | $593 |
2022 | $720K | $670K | −7.0% | $623 | $597 |
2023 | $687K | $660K | −3.9% | $616 | $612 |
2024 | $740K | $707K | −4.5% | $657 | $645 |
2025 | $713K | $730K | +2.5% | $665 | $634 |
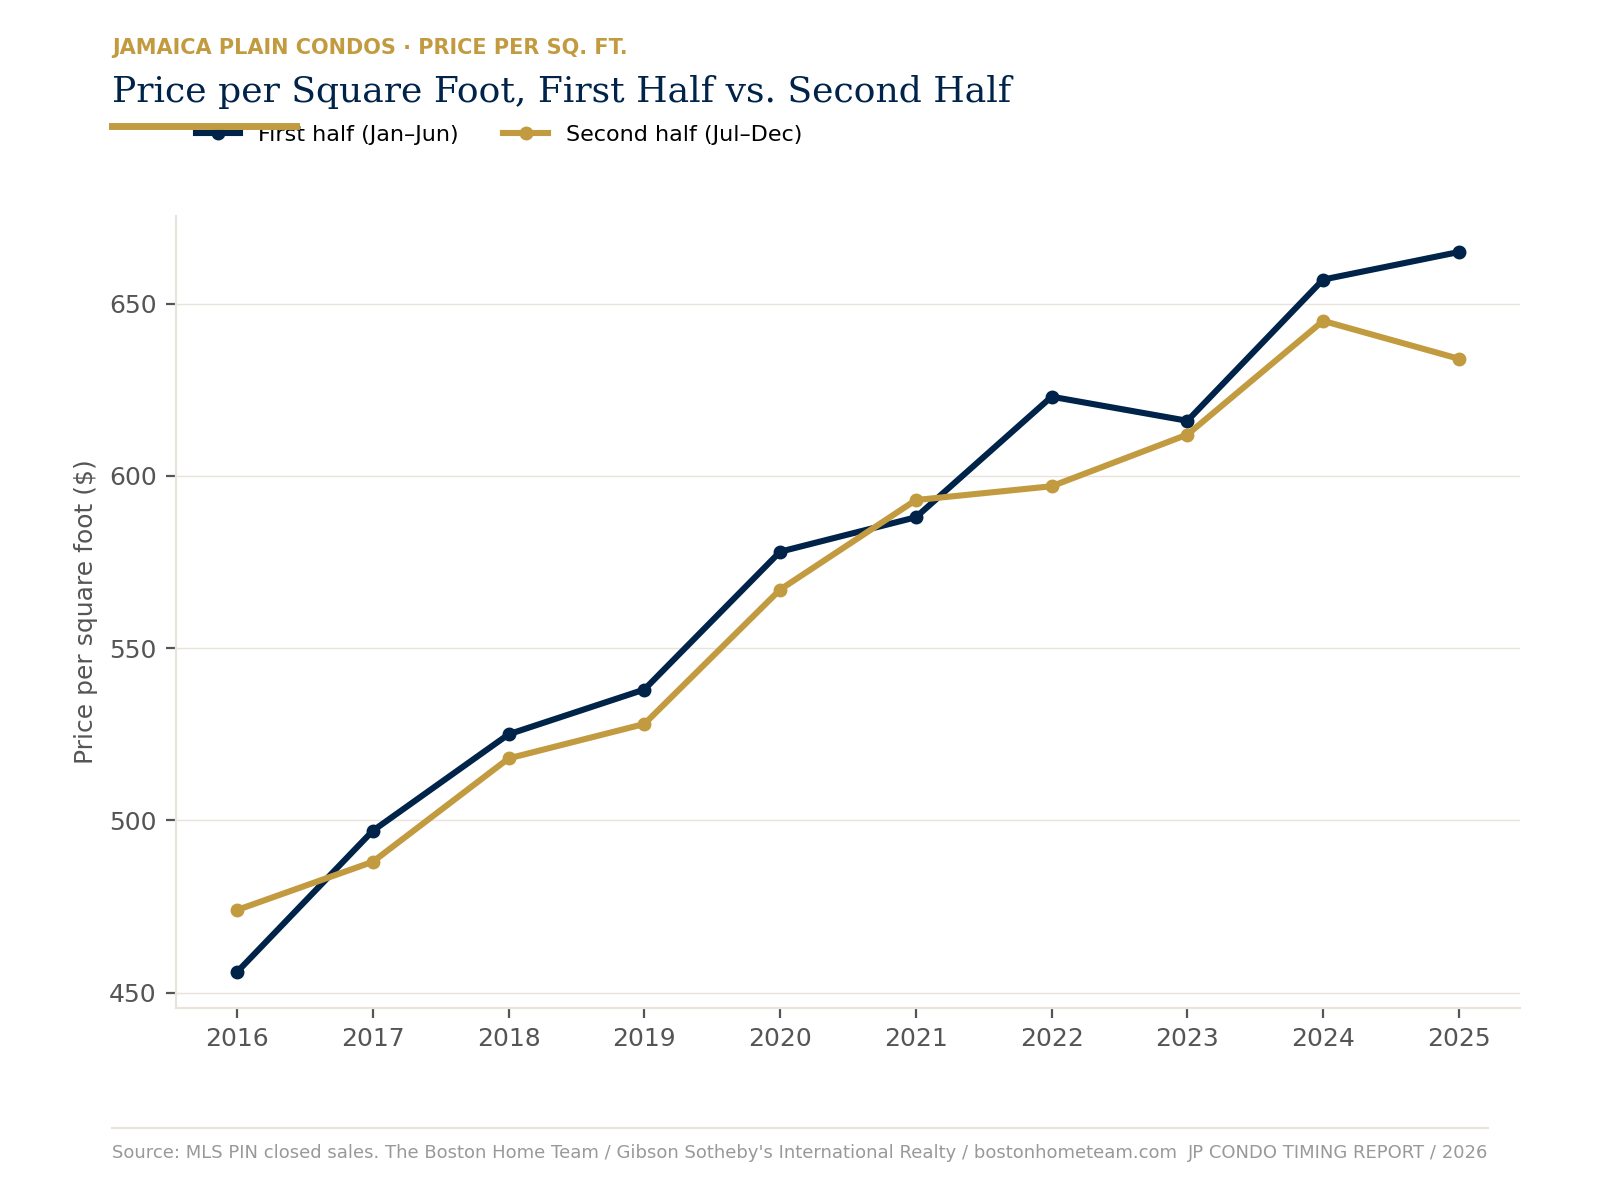
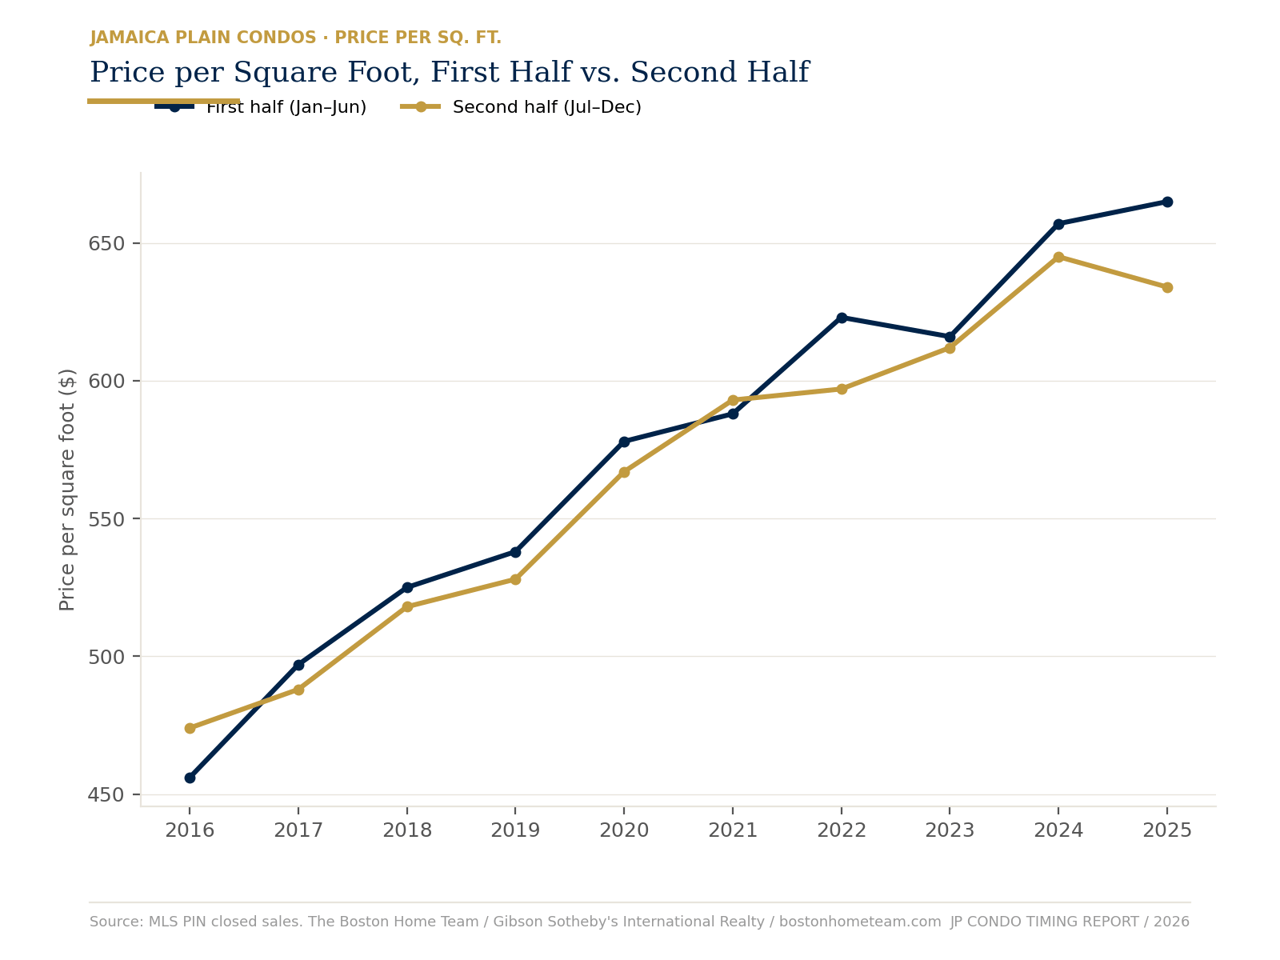
Price per square foot is the steadier read, because it partly corrects for the fact that different sizes of condo sell in different months. On that measure the second half came in lower in eight of ten years. But the effect is modest — a little over one percent on average — and it's not the number we'd hang a six-month decision on.
Median price moves when the mix of what sold changes, not just when values change. The first half of 2026 is a clean example: the median Jamaica Plain condo sale came in at $773K, up about 8% from the first half of 2025 — while average price per square foot actually fell roughly 4%, from $665 to $638. Translation: larger units made up more of the mix this spring. The neighborhood did not appreciate 8% in a year. Any seller being shown a headline median without that context is being shown half the picture.
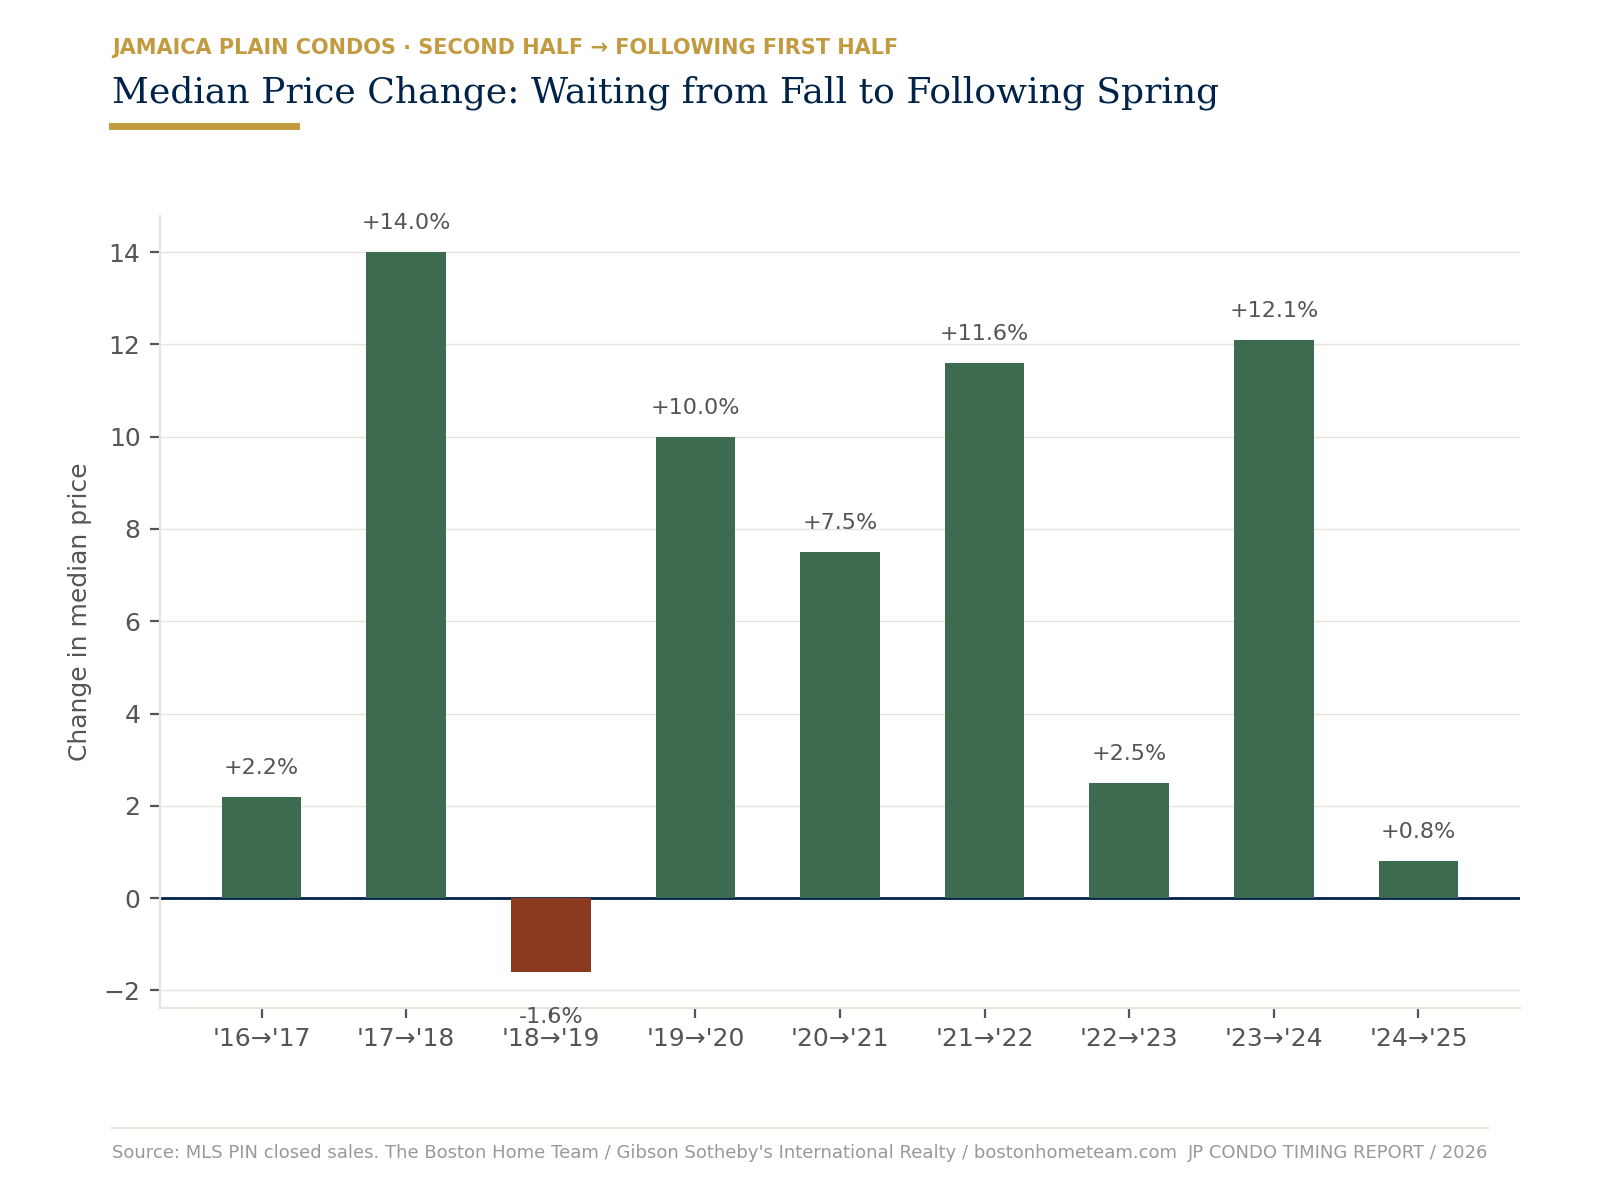
Strictly speaking, a seller deciding today isn't choosing between the first and second half of the same year. They're choosing between this fall and next spring — so the honest comparison is each second half against the first half that followed it.
From H2 of… | …to H1 of | Median then | Median after waiting | Change |
|---|---|---|---|---|
2016 | 2017 | $518K | $530K | +2.2% |
2017 | 2018 | $535K | $610K | +14.0% |
2018 | 2019 | $610K | $600K | −1.6% |
2019 | 2020 | $587K | $645K | +10.0% |
2020 | 2021 | $650K | $699K | +7.5% |
2021 | 2022 | $645K | $720K | +11.6% |
2022 | 2023 | $670K | $687K | +2.5% |
2023 | 2024 | $660K | $740K | +12.1% |
2024 | 2025 | $707K | $713K | +0.8% |
Waiting produced a higher median in eight of the last nine transitions, with a typical gain around 7%. Price per square foot rose in nine of nine.
We want to be straight about what that does and doesn't prove. Most of that gain is ordinary appreciation, not seasonality — it's what happens when you hold a Boston condo for six more months during a fifteen-year run of rising prices. It is not a guarantee. A rate shock, a wave of new construction, or a softer employment picture would break the pattern, and the 2018-to-2019 line shows what a down transition looks like. Anyone who tells you waiting is risk-free is selling you something.
The case for spring has a price tag, and it belongs in the conversation up front. Six additional months of carry — mortgage principal and interest, property taxes, condo fees, insurance, utilities — runs many Jamaica Plain owners $4,000 to $6,000 a month. Call it $25,000 to $35,000 to hold the unit through the winter.
Weigh that against the realistic upside: roughly $8,500 in negotiating leverage on a $775K list price, plus whatever appreciation the next two quarters deliver. For an owner who has already moved out and is carrying two housing payments, fall often wins on arithmetic alone. For an owner still living in the unit, whose alternative is paying the same costs they'd pay anyway, the calculation looks very different.
When we tell sellers to list this fall instead
- The unit is already empty. Vacant carry is the fastest way to erase a seasonal advantage.
- Your next purchase is time-bound. A school year, a job start date, or a contingent offer outranks a percentage point.
- Your unit stands out most in a thin market. A well-renovated two-bedroom with parking can be more distinctive against November's twelve competing listings than against May's forty.
- Something structural is coming. A pending special assessment, a master insurance change, or a building project can be much easier to explain now than after it lands.
What a strong five-month runway buys you
- Paint, decluttering, and the small repairs that get deferred when a listing is rushed to market
- Staging booked at normal rates rather than whatever is available in ten days
- Photography and video shot with the light and landscaping working in your favor
- A pre-listing walkthrough and a pricing strategy set in January against fresh fourth-quarter data, not a guess made in August
Jamaica Plain condos sell year-round, and there is no month in which a well-priced, well-presented unit fails to find a buyer. But if you have the luxury of time, the ten-year record is about as clear as market data gets on the one thing sellers control least: in the second half of the year, buyers negotiate harder and win more often.
Our recommendation for owners without a deadline is to use the fall and winter to prepare properly and target a spring launch. For owners with a deadline, the answer is not to fight the calendar — it's to price and present sharply enough that the seasonal discount never gets applied to you.
This report covers Jamaica Plain condominium sales using closed MLS PIN data from 2016 through the first half of 2026, compared by half-year (January–June vs. July–December) across the full ten-year period. Half-year sample sizes ranged from 129 to 252 closed sales. This report is part of an ongoing series tracking real estate conditions across Greater Boston coverage markets published each season by The Boston Home Team at Gibson Sotheby's International Realty. BJ Ray has tracked Greater Boston real estate data across these markets for 21 years.
Methodology. Closed condominium sales in Jamaica Plain, Suffolk County, from MLS PIN, 2016 through the first half of 2026, grouped into first-half (January–June) and second-half (July–December) closings. Sale-to-list, price per square foot, and days to offer are averages; price figures are medians unless labeled otherwise. Because these are closing dates, each period reflects contracts signed roughly a month earlier. Past performance is not a prediction, and no market statistic substitutes for advice on your specific unit.
Which one are you?
The right answer depends on your carrying costs, your unit's specifics, and your timeline — not on an average. We'll run your building's actual comparable sales, model both timing scenarios side by side, and tell you plainly which one we'd choose if it were ours.
Send us a message · Join our mailing list
The Boston Home Team at Gibson Sotheby's International Realty