The trucks have come and gone. Storrow Drive claimed its annual victims, the curbs have been picked over, and 864 leases started on September 1 alone — the single largest lease-start day of the Boston year, as it is every year.
That's the part everyone sees. Here's the part they don't.
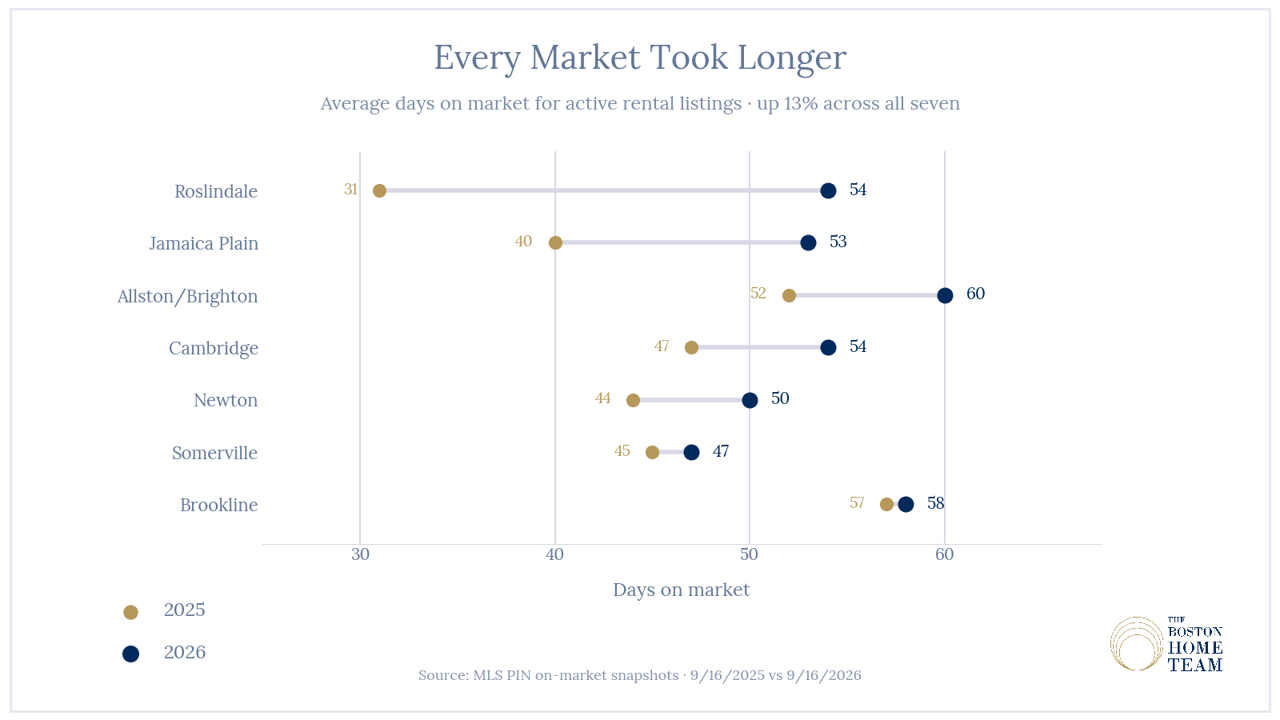
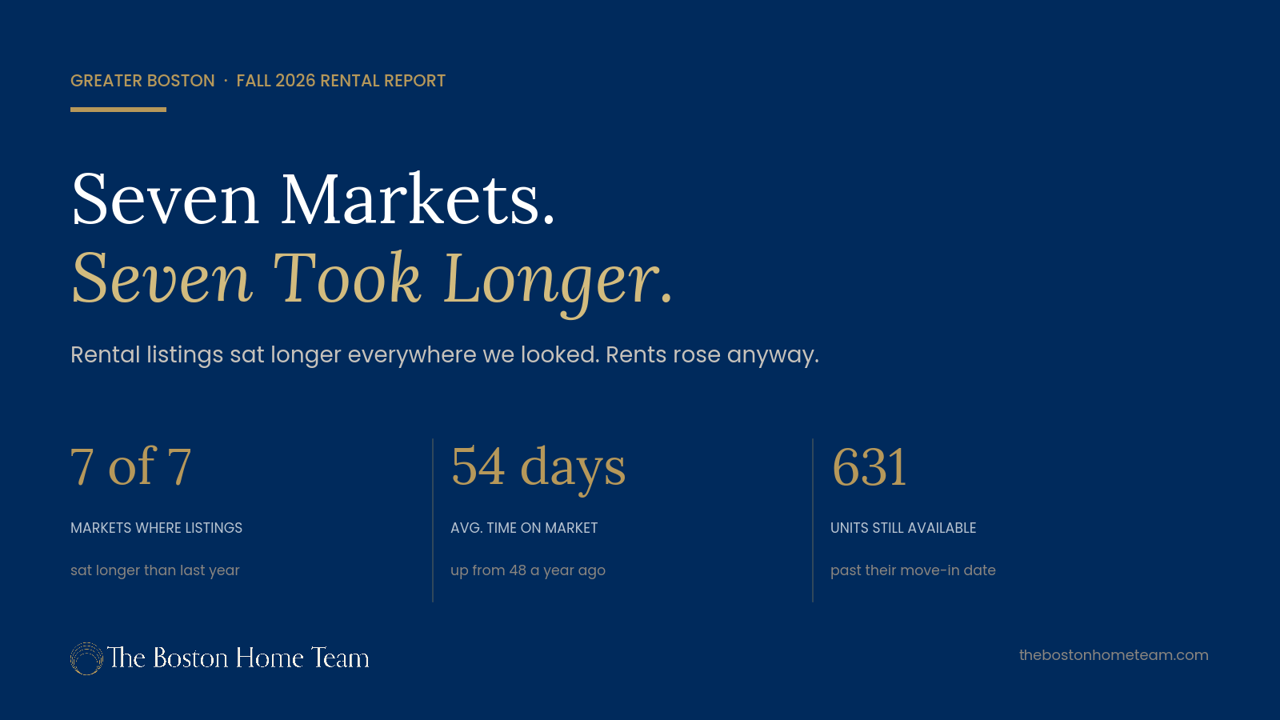
We pulled the on-market snapshot for seven markets on September 16 and compared it against the same date a year ago. In all seven, rental listings are sitting longer than they were. Not most. All seven.
And in five of those seven, rents went up anyway.
Every Market Took Longer
Market | Active Listings | Avg. Days on Market | Median Asking Rent |
|---|---|---|---|
Roslindale | 31 to 47 | 31 to 54 | $2,800 to $3,200 |
Jamaica Plain | 84 to 105 | 40 to 53 | $3,162 to $3,200 |
Allston/Brighton | 190 to 268 | 52 to 60 | $3,000 to $3,031 |
Cambridge | 330 to 273 | 47 to 54 | $3,600 to $3,600 |
Newton | 159 to 149 | 44 to 50 | $3,900 to $3,800 |
Somerville | 206 to 224 | 45 to 47 | $3,300 to $3,525 |
Brookline | 230 to 191 | 57 to 58 | $3,650 to $3,950 |
Each pair reads September 16, 2025 to September 16, 2026.
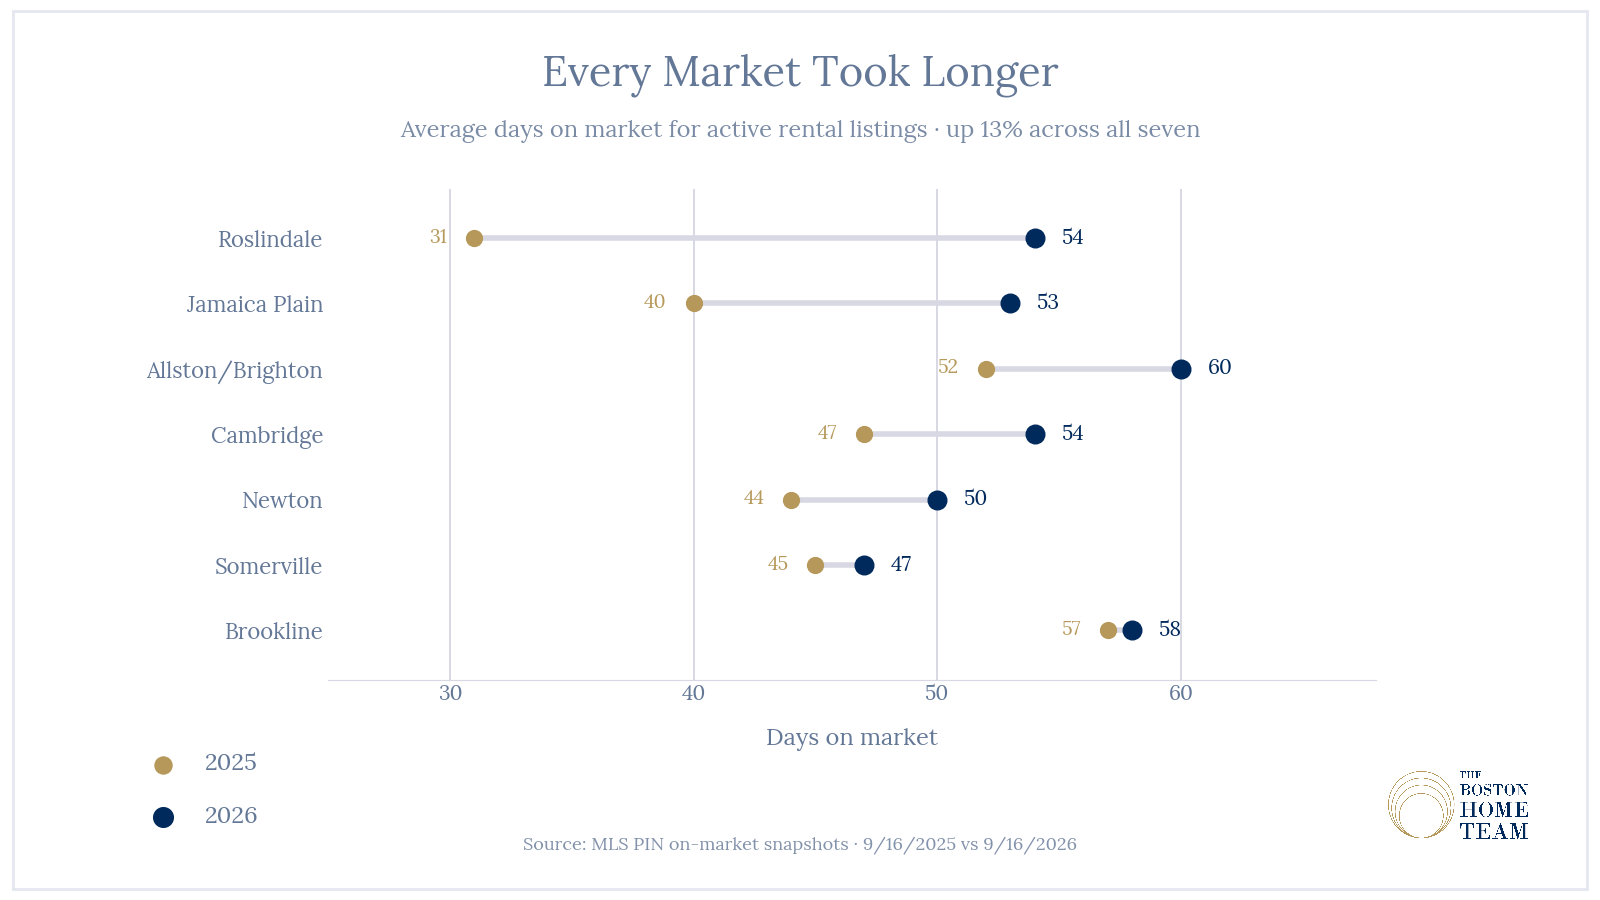
Weighted across all seven, the average listing has been on the market 54 days, up from 48 a year ago — a 13% increase. Total inventory across the seven is up only 2.2%, from 1,230 listings to 1,257.
That combination is the whole story. Supply barely moved. Time moved a lot.
If there were meaningfully more units competing for the same renters, longer market times would be the obvious consequence. That's not what happened. Roughly the same amount of inventory is taking noticeably longer to clear, which means the change is on the demand side — renters are moving more slowly, looking at more units, and taking longer to commit.
Roslindale is the extreme case: listings up from 31 to 47, and time on market up 74%, from 31 days to 54. It's a small market and the percentages move fast, but the direction is unambiguous.
Supply is up 2.2%. Time on market is up 13%. When inventory barely moves and listings sit substantially longer, the change isn't coming from the supply side — it's coming from renters, who are taking their time.
Slower Doesn't Mean Cheaper
The instinct when listings sit longer is to assume prices are about to give. They haven't.
Asking rents rose in five of the seven markets. Brookline is up 8.2%, Somerville 6.8%, Roslindale 14.3%. Cambridge is exactly flat at $3,600. Only Newton came down, and only by 2.6%.
That holds when you look at completed leases rather than asking prices. Across the region this summer, every unit type got more expensive: studios from $2,300 to $2,400, one-bedrooms from $2,850 to $2,900, two-bedrooms from $3,400 to $3,450, three-bedrooms from $3,950 to $4,000.
Worth knowing if you read the regional median anywhere else: it shows a 1% decline, from $3,332 to $3,300. That's a composition effect, not a price move. Studios rose from 6.6% of all leases to 7.2% while four-bedroom-plus units fell from 8.4% to 7.7% — more small units in the pool pulls the overall median down even as every individual size climbs. Hold the mix constant and rents rose 1.5%. Measure by the square foot and you get 1.6%. Two methods, same answer.
So the market is slower and more expensive at the same time. Those aren't in tension — they're what happens when renters have enough choice to be patient but not enough leverage to negotiate.
Eleven Days in Charlestown, Forty-Five in Allston
Everything above measures listings currently sitting on the market. A different question is how long the leases that did get signed took to get there — and for the first time, the data answers it.
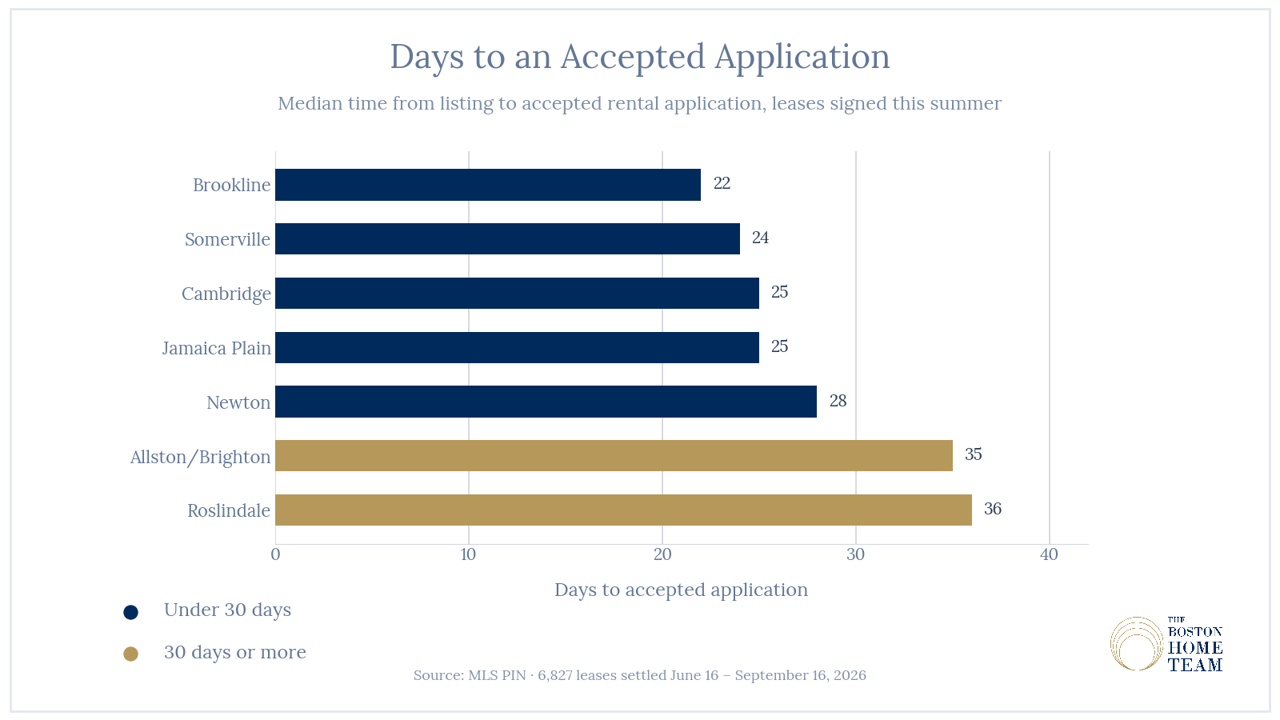
Across 6,827 leases signed between mid-June and mid-September, the median took 24 days to reach an accepted application. The spread underneath that is enormous.
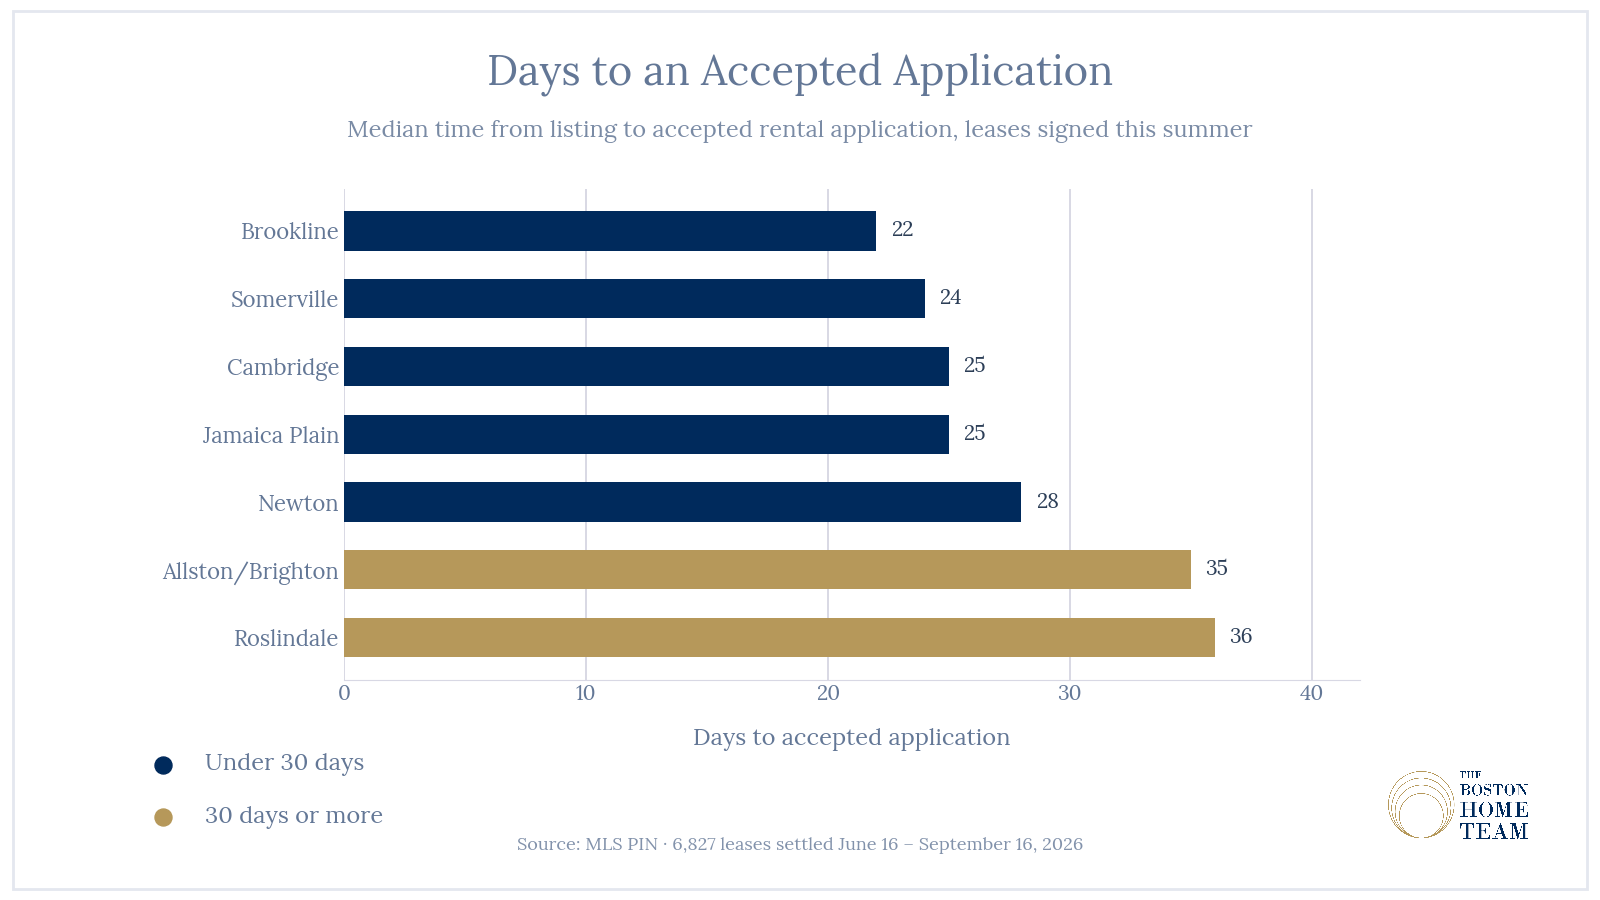
Market | Days to Accepted Application | Median Achieved Rent |
|---|---|---|
Brookline | 22 | $3,550 |
Somerville | 24 | $3,300 |
Cambridge | 25 | $3,500 |
Jamaica Plain | 25 | $3,298 |
Newton | 28 | $3,800 |
Allston/Brighton | 35 | $2,916 |
Roslindale | 36 | $3,100 |
Elsewhere in the city the range runs wider still — Charlestown at 11 days and South Boston at 13 on the fast end, Mission Hill at 72 and Roxbury at 60 on the slow end.
Bedroom count matters more than most people expect. Two-bedrooms move fastest at 23 days. Four-bedroom-plus units take 39.5 — nearly twice as long — and they're the segment where the September calendar bites hardest, because a four-bedroom that misses the student cycle waits a long time for the next one.
One more number that reframes September: leases starting September 1 took a median of 31 days to reach an accepted application, against 25 for everything else. The biggest move-in date of the year is also one of the slower ones to fill. Landlords who assume the September wave rents itself are pricing off a myth.
631 Units Are Sitting Past Their Own Move-In Date
As of September 16, there were 1,193 rental units available across these seven markets. Of those, 631 have an availability date of September 30 or earlier — they were supposed to be occupied by now, and they aren't.
Market | Available Now | Past Move-In Date | Median Ask |
|---|---|---|---|
Cambridge | 257 | 144 | $3,600 |
Allston/Brighton | 254 | 137 | $3,100 |
Somerville | 216 | 118 | $3,525 |
Brookline | 181 | 106 | $3,950 |
Newton | 143 | 62 | $3,700 |
Jamaica Plain | 97 | 50 | $3,295 |
Roslindale | 45 | 14 | $3,100 |
Better than half of everything currently available in these markets has already missed its date. In Cambridge and Allston/Brighton the ratio is worse. This is the fall rental market in one number: the September cycle didn't clear, and what's left behind competes into a much thinner October and November demand pool than the one it was priced for.
One caveat worth stating plainly: rental records land late. Nearly a third of last September's leases weren't in the data until months afterward. So 631 is a floor — some of those units have almost certainly rented and haven't posted yet. The real figure is lower, and the direction still holds.
Both Markets Repriced in Time
We published the summer sales report two weeks ago and found almost exactly this, in a completely separate dataset. Condo days-to-offer across 145 Greater Boston markets went from 11.1 days in summer 2024 to 16.0 this summer. Single-family from 7.1 to 8.3. Prices in both segments held roughly flat.
Now the rental market: time on market up 13% in a year, rents up modestly, supply essentially unchanged.
Two different tenures, two different datasets, the same shape. Buyers and renters are both taking longer to commit, and neither is getting much of a discount for the patience.
Where they diverge is what it means for owners. For a multi-family owner specifically, the combination is genuinely favorable for the first time in three years: multi-family sale prices fell 4.7% this summer while rents rose. Income up, acquisition cost down. That's a wider yield than you could get a year ago — though at 6.87% on the thirty-year, the financing math still has to clear a much higher bar than it did in 2021.
What This Means for You
If you're listing a rental this fall: price it for a 54-day market, not a 48-day one. The units renting closest to asking are the ones that priced correctly on day one — 77 to 81% of leases in these markets signed at exactly the asking rent, which means the market rewards accuracy far more than it rewards optimism.
If you own a unit that didn't clear on September 1: you're one of 631, and the pool you're competing into gets thinner every week from here. The question isn't whether to adjust, it's whether to adjust now or in November after another six weeks of carrying cost.
If you own four-bedroom inventory: your segment takes 39.5 days to an accepted application, the slowest of any unit size, and it's the most calendar-dependent. Plan next year's listing date backward from September 1, not forward from August.
If you're renting right now: October is the best month you'll see until spring. Inventory that missed its date is still on the market, landlords are carrying it, and roughly one lease in ten is signing below asking — up from a year ago in most of these markets.
If you own a multi-family and you've been watching prices soften: the rent side moved the other way. Worth running the numbers before you conclude the whole picture is deteriorating.
The Numbers Are One Thing. The Experience Is Another.
BJ presented a thorough analysis of the market, gave expert advice on physical improvements to make, and marketed the listing successfully. The house sold within one week at a price 10% higher than we thought we would receive — all during a recession.
I felt like I was their only client. BJ went above and beyond continuously and made what can be one of life's most stressful experiences completely manageable. I was in the best of hands and had a terrific outcome with the sale of my condo.
What We're Watching
The rental market thins out from here. Roughly 58% of all January-through-September leasing happens between June and September, and that share has been stable every year we've measured. What's left of the year is quiet.
Two things worth watching. The first is whether the 631 units clear in October or carry into winter — if they carry, spring asking rents will be set against a softer baseline than this year's. The second is whether the slowdown reaches achieved rents. So far it hasn't: listings sit longer, but the ones that rent are renting for more. Those two can't diverge forever.
We'll have a clearer read by the spring leasing season, which in this market effectively begins in February.
Own Rental Property in Greater Boston?
If you'd like a read on what your specific building rents for against comparable units — or what this fall's numbers mean for a property you're thinking about buying or selling — we'd welcome the conversation.
This is the companion to our Greater Boston Summer 2026 Market Report, which covers the sales side across 145 markets.
Sources: MLS PIN on-market snapshots for Roslindale, Jamaica Plain, Allston/Brighton, Cambridge, Somerville, Brookline, and Newton, comparing active rental listings on September 16, 2025 and September 16, 2026. Completed-lease figures from MLS PIN rental records covering 6,827 leases settled June 16 – September 16, 2026. Multi-year rent comparisons from a unified lease history covering the June–August window, 2023–2026. Active-listing days on market and days to an accepted application on completed leases are distinct measures and are reported separately. Rental records post late; September figures understate final counts. MLS records cover listed units only and exclude the no-fee and direct-from-landlord market. Multi-family sale figures from MLS PIN closed sales, June–August 2026. The Boston Home Team · Gibson Sotheby's International Realty.