Published October 28, 2026. Sales data through September 30, 2026. Inventory data through October 27, 2026. Mortgage rates as of October 28, 2026.
The one finding
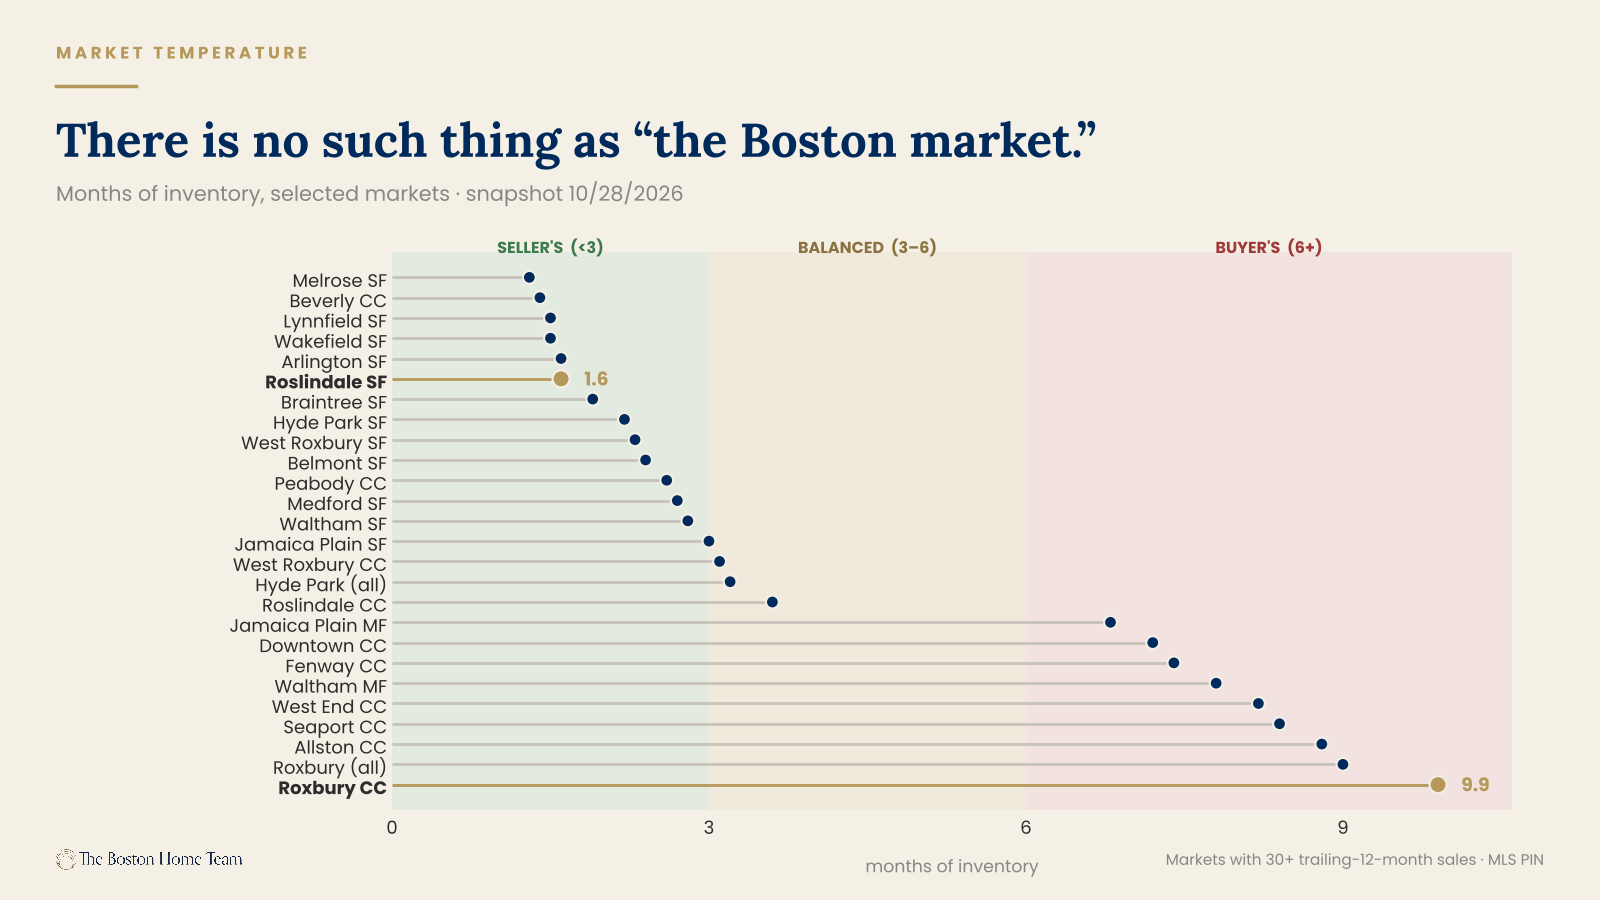
Roslindale single-family homes are at 1.6 months of inventory. Roxbury condominiums are at 9.9.
Those two markets are three miles apart. Same city. Same quarter. Same interest rates, same buyers walking through the same open houses on the same Sunday afternoons. One of them is among the tightest markets in Greater Boston. The other is among the loosest. If you only read one line of this report, read that one — because it is the single best argument against every sentence that begins "the Boston market is."
There is no such thing as the Boston market. There are roughly four hundred of them, and this quarter they moved in opposite directions.
Here is the short version of everything below.
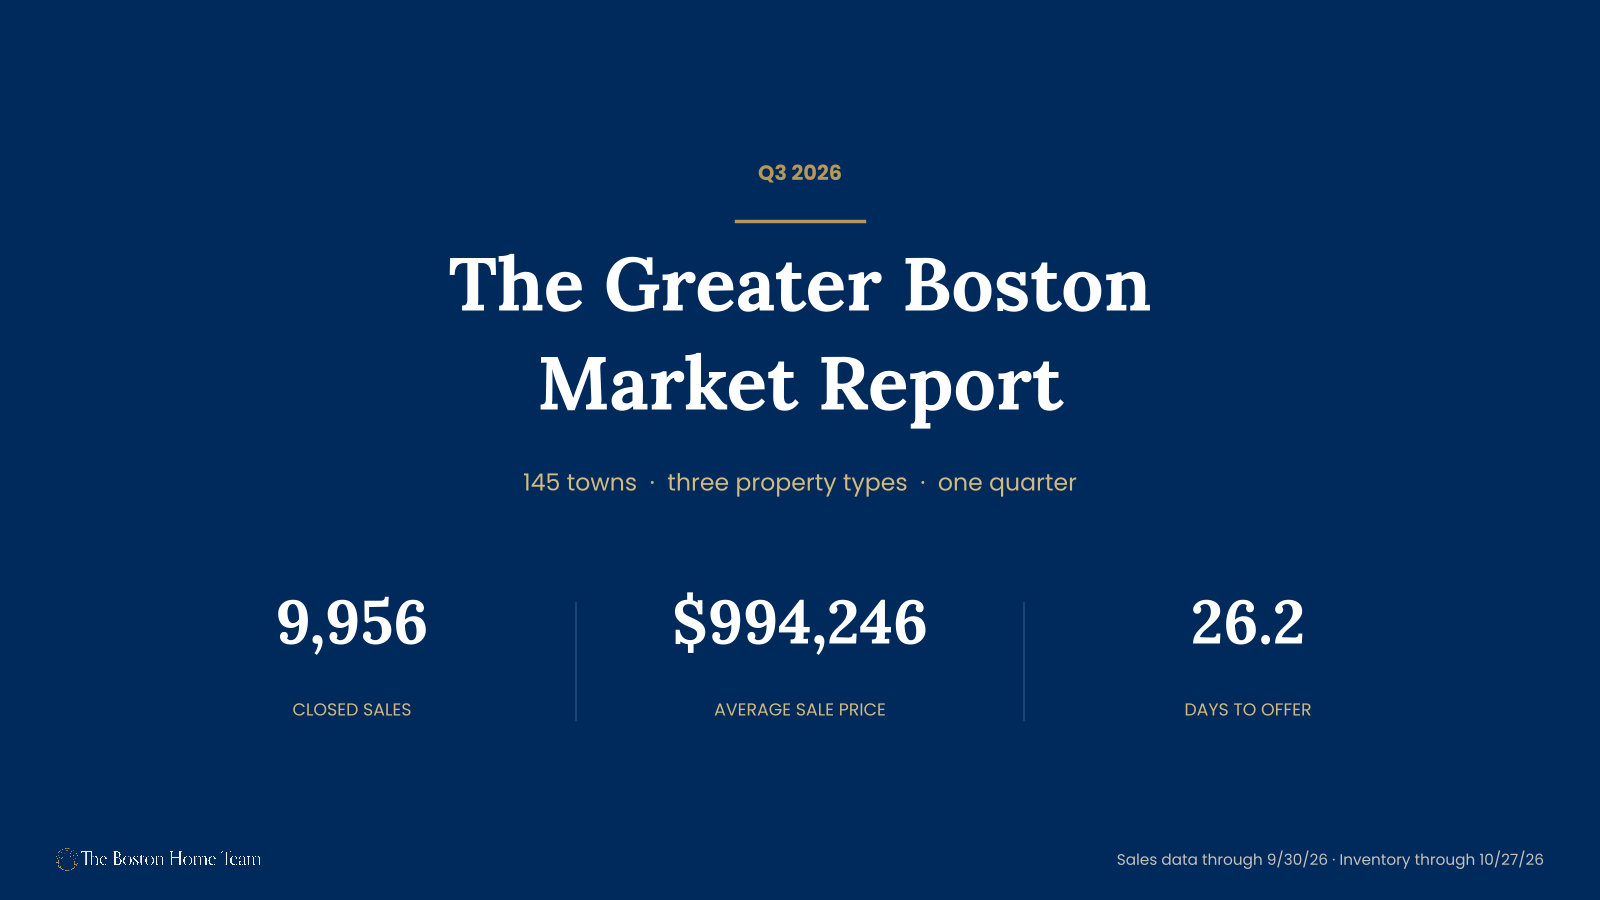
- Volume held. 9,956 closed sales across 145 towns, up 1.9% from Q3 2025 and up 7.0% from Q2.
- Prices held. Volume-weighted average sale price $994,246, up 1.7% year over year. Average price per square foot $501, up 1.1%.
- Speed did not hold. Average days to offer went from 24.5 to 26.2. Sale-to-list slipped from 100.79% to 100.68% — and from 101.77% in Q2, which is the sharper move. Across the region, 87 market segments carry a demand-cooling flag against 63 flagged as strengthening.
- The middle won, and we think we know why. Homes between $900,000 and $1.2 million were the only price band in the region that sold faster than a year ago. That band is also the last one that still fits inside a conforming loan at 20% down — the limit in all four counties is $962,550.
- Single-family is firm, condos are a coin flip, multifamily is soft. Zero single-family markets in our 65-area pool are in buyer's territory. Ten condo markets are.
- Our six core neighborhoods underperformed the region on volume — 534 sales, down 4.6%, against a regional +1.9%. We'll explain why rather than hide it.
- Q4 will not be an ordinary autumn. The 30-year fixed is at 7.35% today against 6.13% a year ago, and most of that move landed after the quarter closed.
The thesis, stated once so you can argue with it: the Q3 price numbers describe a market that no longer exists.
That isn't a figure of speech. The homes that closed in July, August, and September went under agreement roughly between May and August, when the 30-year fixed was running between about 6.4% and 6.9%. As of today it's 7.35%. Every closed sale in this report was financed at a cost of money that is no longer on offer — roughly $320 a month cheaper, on a regionally average home, than what the buyer walking into your open house on Sunday will be quoted.
Price is also the slowest-moving indicator in real estate, lagging the actual balance of supply and demand by a quarter or two. Days to offer, sale-to-list, and months of inventory all moved against sellers this summer, and the price data hasn't caught up. If you're pricing a listing off Q3 comps right now, you're pricing to a market that ended in September and financing it at a rate that ended in August.
How to read this
Five things to know before the numbers start, because a report this long earns exactly one chance to be precise about its own limits.
There are two data vintages here and they are not the same thing
Everything labeled as a sale comes from closed transactions between July 1 and September 30, 2026. Everything labeled as inventory, months of inventory, pending, absorption, or price cuts comes from a market snapshot taken October 28, 2026, with sales counted through October 27. So when we say Roslindale single-family is at 1.6 months of inventory, that's a late-October reading, not a Q3 reading. Read the report as two acts: here's what happened over the summer, and here's where that left us a month later.
We lead with medians, not averages
Our quarter-specific files report averages, and in several of our core markets those averages are badly distorted by a handful of large sales. Roxbury single-family reads +60.3% year over year on the average and −14.7% on the trailing-twelve-month median. Six sales happened; two were $2.76 million. The average is noise. Where a reliable median exists, we use it, and we say when the two disagree. Note that our medians are trailing-twelve-month figures — the twelve months ending Q3 2026 against the twelve months ending Q3 2025 — so they smooth more than a quarter-over-quarter comparison would. That's a feature when samples are thin and a limitation when a market turns quickly. Both are true at once.
We flag small samples, and there are a lot of them
Of 372 area-and-property-type segments in our summary data, 138 are statistically thin and 82 are very thin. More than a third of this market cannot be honestly reported at the neighborhood level. Anything under ten transactions gets a caveat in the text. Anything under five gets reported as a transaction count only, with no pricing figure attached, because a count is a census and a median of two sales is a rumor.
Mortgage rates are a third vintage, and we treat them as one
Where this report cites the 30-year fixed, the figure is dated and sourced in the footer. Today's rate is a daily reading; the rates that actually financed the Q3 sales in this report were locked weeks to months before each closing. We say which we mean every time, because conflating the two is how a market report ends up describing a financing environment that no buyer currently faces.
We report neighborhoods separately
You will not find a blended "Olmsted corridor" statistic in this document, even though Jamaica Plain, Roslindale, West Roxbury, and Hyde Park sit along the same green ribbon and share a great deal of buyer traffic. They are four distinct markets with four distinct answers this quarter, and averaging them would destroy the only thing worth knowing.
The market at large
Greater Boston closed 9,956 sales in the third quarter of 2026 across 145 cities, towns, and Boston neighborhoods. That's up 1.9% from the 9,772 sales in Q3 2025, and up 7.0% from the second quarter. By volume, this was a normal summer.
+1.9% YoY
+1.7% YoY
+1.1% YoY
+1.7 days YoY
By price, it was also a normal summer. The volume-weighted average sale price came in at $994,246, up 1.7% year over year. Price per square foot averaged $501, up 1.1%. Neither of those numbers is dramatic. Neither of them tells you anything is wrong.
The speed numbers do.
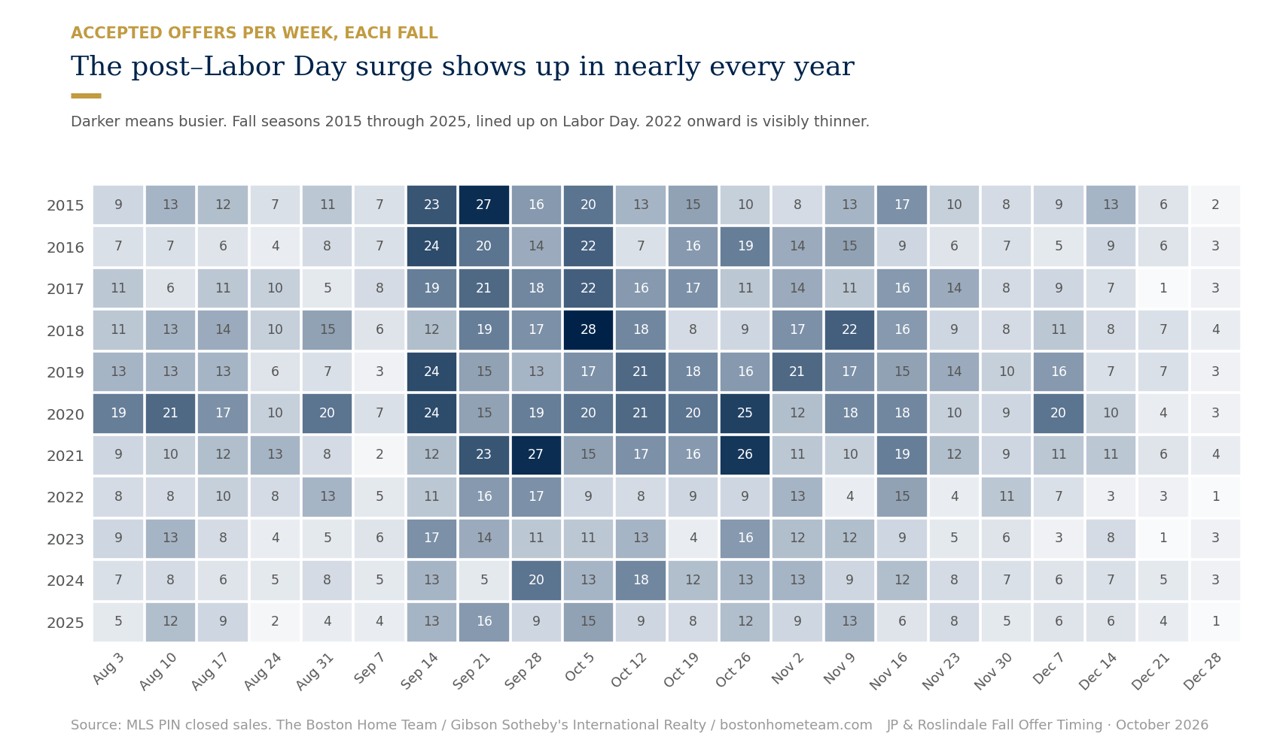
Average days to offer rose from 24.5 to 26.2 — call it a day and a half, which sounds like nothing until you remember this is an average across ten thousand transactions in the strongest season of the year. Sale-to-list fell to 100.68% from 100.79% a year ago. The more revealing comparison is against the second quarter, when sale-to-list sat at 101.77%. Over the course of a single summer, the typical Greater Boston seller went from banking on roughly 1.8% above asking to roughly 0.7% above asking.
Underneath the regional aggregate, 87 segments carry a demand-cooling flag against 63 flagged as strengthening. That ratio is the cleanest single summary of the quarter: the market is still functioning, still clearing, still appreciating slightly — and the balance of momentum has tipped toward buyers in a clear majority of submarkets.
Volume and price are confirming indicators. Days to offer and sale-to-list are leading ones. This quarter the confirming indicators said "fine" and the leading indicators said "slowing." When those two disagree, the leading indicators are the ones that turn out to have been right.
The barbell
Here is the most interesting thing in the data, and almost nobody is writing about it.
We bucketed every reliable market segment — ten or more transactions — by average Q3 sale price, then asked a simple question: which price band had the best quarter?
Price band | Segments | Sales | Days to offer (vs. LY) | Sale-to-list | Volume YoY | $/sqft YoY |
|---|---|---|---|---|---|---|
Under $600K | 53 | 1,540 | 28.3 (+3.3) | 99.84% | +0.2% | −1.6% |
$600K–$900K | 72 | 3,570 | 23.2 (+1.5) | 101.15% | +1.3% | +0.6% |
$900K–$1.2M | 54 | 2,020 | 22.2 (−0.9) | 101.66% | +7.6% | +0.7% |
$1.2M–$1.8M | 39 | 1,464 | 28.8 (+0.9) | 100.44% | +1.2% | +1.9% |
$1.8M+ | 16 | 788 | 35.6 (+4.5) | 99.46% | +0.9% | +4.0% |
Reliable segments only (10+ transactions). Swipe to see the full table.
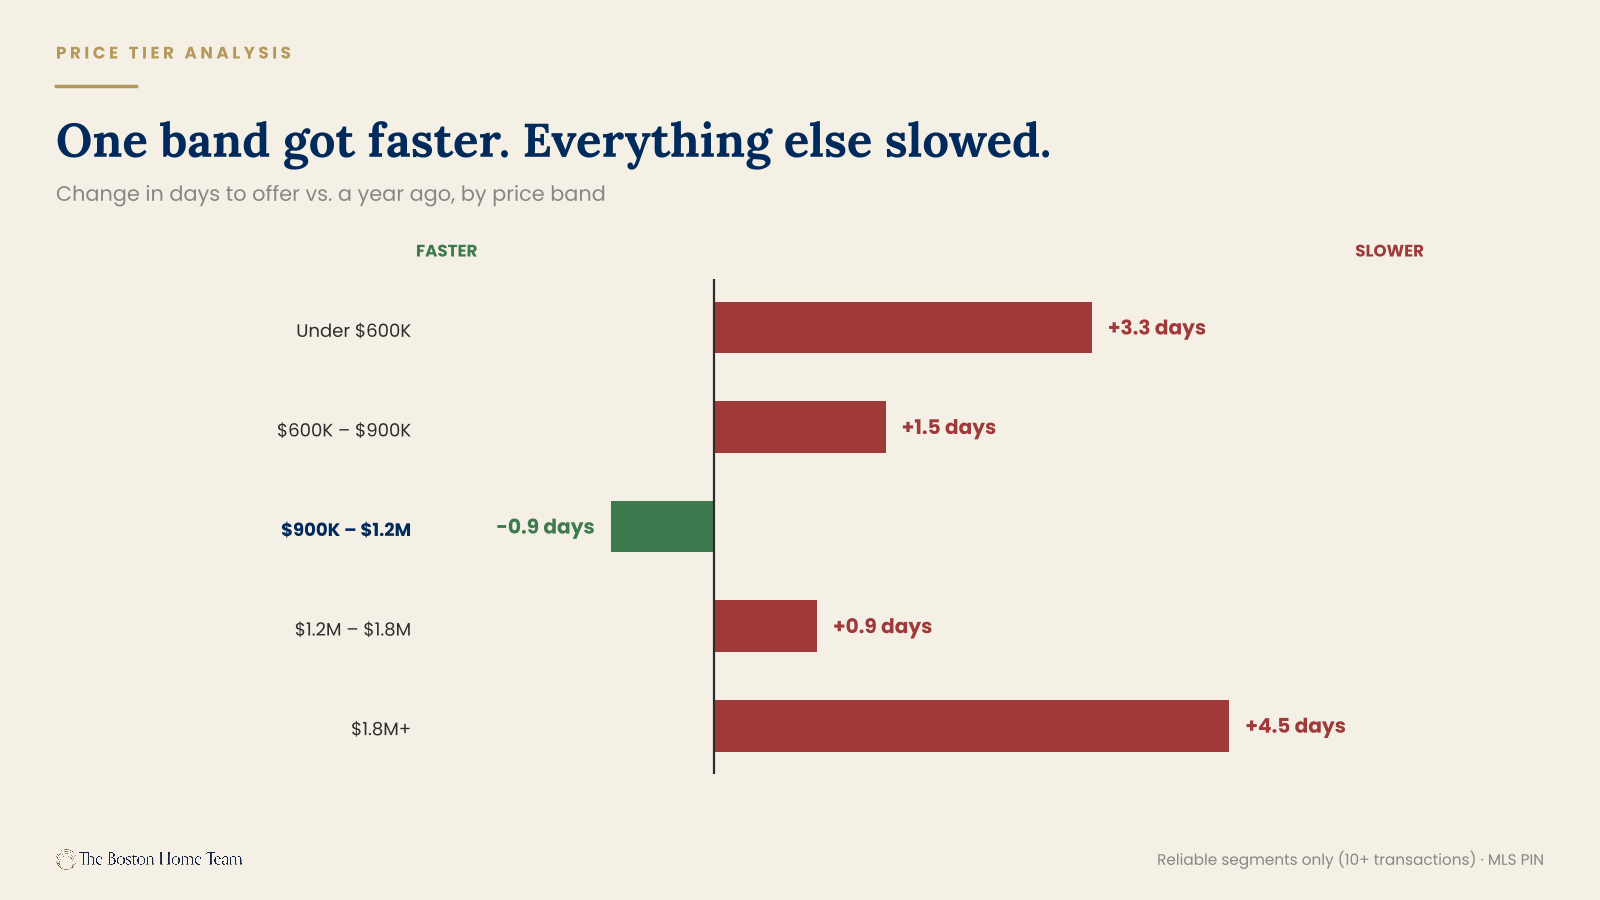
The $900,000 to $1.2 million band is the only segment in the entire region where homes sold faster than they did a year ago. It is also the only band with meaningful volume growth, at +7.6%, and it carries the strongest sale-to-list in the market at 101.66%. One band, three wins.
Both ends lost.
At the bottom, homes under $600,000 added 3.3 days and sale-to-list fell below par, to 99.84%. That number matters more than it looks. It means the typical entry-level seller in Greater Boston is now taking less than asking price — the first time that's been true in this dataset. Price per square foot in that band is down 1.6%, the only decline of any band.
The affordability floor is losing buyers, and the monthly payment is the obvious culprit. The 30-year fixed averaged 6.13% a year ago and sits at 7.35% today. On a $550,000 home with 10% down, that's roughly $400 a month more for the identical house — which works out to about $17,000 of additional annual income needed to qualify at a standard front-end ratio.
That is not a buyer who changed their mind. That is a buyer who no longer clears underwriting.
At the top, homes above $1.8 million added 4.5 days — the largest increase of any band — and sale-to-list sits at 99.46%. Luxury sellers in this market are now routinely taking less than ask.
Which brings us to the counter-narrative. Every market report you will read this quarter says luxury is insulated. The usual evidence is price per square foot, which in the $1.8M+ band is up 4.0% — the strongest growth of any price band in the region. Case closed, apparently.
It isn't. That number is survivorship. When a segment's price per square foot rises while its days on market rise and its sale-to-list falls, you are not looking at strength. You are looking at selection: only the best properties are trading, the rest are sitting, and the ones that trade are dragging the per-foot average up behind them. Thirty-five days to offer at 99.46% of ask is not an insulated market. It is a market where the sellers who are willing to meet the buyer get a deal done and the sellers who aren't, don't.
If you are the move-up buyer or the seller sitting at $1.05 million, this section is your section. That band is a very large share of our six core neighborhoods, and right now it is the best place in Greater Boston to be a seller.
Why the middle won: the conforming line runs straight through it
This is the part of the report we're least certain about and most interested in. Read it as a hypothesis with good evidence behind it, not a settled finding.
The 2026 conforming loan limit in Suffolk, Middlesex, Norfolk, and Essex counties is $962,550. All four, the same number. That sits well above the $832,750 national baseline, because Greater Boston carries a high-cost designation — but it is still a hard line, and mortgages above it are jumbo loans priced in a separate market.
At 20% down, a $962,550 mortgage buys a $1,203,188 home.
Now read that against the table above. The band that beat every other band in the region — faster than last year, best sale-to-list, the only meaningful volume growth — runs from $900,000 to $1.2 million. It is, nearly to the dollar, the last band that still fits inside a conforming loan at 20% down. The band directly above it is the first one that pushes a typical buyer into jumbo.
30-year fixed | A year ago | Today | Change |
|---|---|---|---|
Conforming | 6.19% | 7.33% | +1.14 pts |
Jumbo | 6.15% | 7.60% | +1.45 pts |
Jumbo premium | −0.04 pts | +0.27 pts | ~31 bps |
A year ago jumbo was cheaper than conforming. Source: Mortgage News Daily.
Which suggests the barbell may not be a story about buyer psychology at all. It may be a story about where the financing gets worse at both ends. Under $600,000, the problem is the level of rates. Between $900,000 and $1.2 million, buyers have income and equity and they still clear the conforming line. Above roughly $1.2 million, the problem is the structure of rates — those buyers aren't payment-constrained, but their money got 31 basis points more expensive than everyone else's, and they're the cohort most able to wait.
The honest caveats. Twenty percent down is an assumption: at 10% down the conforming ceiling falls to about $1,069,500, and at 25% down it rises to roughly $1,283,400. So it isn't a cliff at a single price, it's a zone between roughly $1.07M and $1.28M that shifts with each buyer's down payment. And this is correlation. We can show that the best-performing band sits just under the conforming limit. We can show that the jumbo spread moved against large loans. We cannot show from this data that one caused the other.
But it is the first explanation we've found that accounts for both ends of the barbell with a single mechanism. If you're advising a seller anywhere near $1.2 million, the gap between listing at $1,195,000 and $1,235,000 may not be a rounding error. It may be the difference between a conforming buyer pool and a jumbo one.
Three property types, three markets
Single-family | Condo | Multifamily | |
|---|---|---|---|
Q3 sales | 5,659 | 3,525 | 772 |
Volume QoQ | +15.5% | −5.9% | +16.6% |
Volume YoY | +2.0% | +1.3% | +4.2% |
Median months of inventory | 2.4 | 3.8 | 4.7 |
Market call (65-area pool) | 36 seller's, 0 buyer's | 20 seller's, 27 balanced, 10 buyer's | 4 seller's, 12 balanced, 7 buyer's |
Median price YoY (TTM) | +1.7% | +1.0% | −0.3% |
Swipe horizontally to see the full table.
Three types, three genuinely different markets, three different pieces of advice.
Single-family is the healthy one
5,659 sales, up 15.5% from Q2 and 2.0% from last year. Days to offer at 21.9, sale-to-list at 101.68%, price per square foot up 2.3%. Median months of inventory across the pool is 2.4 — comfortably inside seller's territory by our thresholds — and here is the number that settles it: not one single-family market in our 65-area pool is in buyer's territory. Not one. If you own a single-family house in Greater Boston and you are thinking about selling, the data is on your side and it isn't close.
Condos are a coin flip, and the split is the story
3,525 sales, down 5.9% from Q2, with days to offer at 32.5 (up from 29.6) and sale-to-list at 99.38% — below par. But the aggregate hides an inversion worth its own paragraph.
Condo submarket | Sales | Volume YoY | Average price | $/sqft YoY | Days to offer |
|---|---|---|---|---|---|
Downtown core | 548 | +4.0% | $1,407,756 (+5.6%) | +3.2% | 41.1 |
Everything else | 2,756 | +1.8% | $678,703 (−0.4%) | −1.6% | 30.7 |
The two submarkets sum to 3,304 of 3,525 condo sales; the balance sits in segments below our 10-transaction reporting threshold.
For three years running, from roughly 2021 through 2023, the condo story in this region was identical every quarter: downtown lagged, the outer neighborhoods appreciated. Remote work emptied the core, buyers wanted space, and condos in Roslindale and Hyde Park and East Boston climbed while downtown units sat.
That has now fully reversed. Downtown luxury condos are the ones with price growth — up 5.6% on average price and 3.2% on price per square foot. The neighborhood condo market is flat on price and down 1.6% per square foot. The thing that was true for three years stopped being true. If you've been pricing a neighborhood condo off the 2022 pattern, stop.
The caveat, and it's a real one: downtown units are taking 41.1 days to offer against 30.7 everywhere else. Downtown is appreciating slowly, not clearing quickly. Those are different kinds of good news.
Multifamily is the softest asset class in the region
772 sales, up 16.6% from Q2 — but median price is down 0.3% year over year and price per square foot is down 2.1%. Multifamily carries the highest months of inventory of any type at 4.7, with 7 of 23 tracked markets in buyer's territory.
Read those two facts together and you get the actual picture: volume is up because investors are transacting, and pricing is soft because investors are disciplined. An investor buys on the numbers. When the numbers don't work, the investor walks, and they do not get emotionally attached to the kitchen. That's a fundamentally different counterparty than the one a single-family seller is negotiating with, and it's why the multifamily market can be busy and weak at the same time.
Worth knowing what "multifamily" now includes at the top: a 68-unit, 36,202-square-foot building at 510 Willard in Quincy traded for $13.5 million this quarter, listed by Marcus & Millichap. That is institutional capital, not a two-family on your block. When you read a multifamily median, remember the category spans both.
Market temperature
Months of inventory is the spine of this report, so it's worth saying plainly what it is: the number of months it would take to sell every active listing at the current pace of sales. It answers the only question that actually matters to somebody deciding whether to list — is there more demand here than supply, or less?
Our thresholds, the same ones we use in the weekly snapshot: under 3 months is a seller's market. Three to six is balanced. Six or more is a buyer's market.
Across the 65-area pool, as of October 28: 29 seller's markets, 22 balanced, 10 buyer's markets.
The tightest markets in the region
Area | Type | Months of inventory | Active | Pending | Price cuts, 30d |
|---|---|---|---|---|---|
Melrose | Single-family | 1.3 | 22 | 26 | 23% |
Beverly | Condo | 1.4 | 15 | 13 | 27% |
Lynnfield | Single-family | 1.5 | 14 | 15 | 36% |
Wakefield | Single-family | 1.5 | 21 | 21 | 33% |
Arlington | Single-family | 1.6 | 26 | 17 | 23% |
Roslindale | Single-family | 1.6 | 11 | 13 | 0% |
Markets with 30+ trailing-12-month sales.
And the loosest
Area | Type | Months of inventory | Active | Pending | Absorption |
|---|---|---|---|---|---|
Roxbury | Condo | 9.9 | 60 | 15 | 0.10 |
Roxbury | All types | 9.0 | 106 | 28 | 0.11 |
Allston | Condo | 8.8 | 41 | 1 | 0.11 |
Seaport | Condo | 8.4 | 64 | 8 | 0.12 |
West End | Condo | 8.2 | 33 | 4 | 0.12 |
Fenway | Condo | 7.4 | 45 | 0 | 0.14 |
Downtown | Condo | 7.2 | 154 | 21 | 0.14 |
Snapshot 10/28/2026.
Two things jump off those tables.
Fenway has 45 active condos and zero pending. Not a few. Zero. Allston has 41 active and one pending. A market with inventory and no pipeline is a market where the next sale sets the comp for everybody, and nobody wants to be the one who sets it low.
Four of the loosest seven markets in the region are downtown Boston condos. Hold that next to the section above, where downtown condos showed the strongest price growth in the entire condo market. Both are true. Prices are up because the units that trade are the good ones; inventory is deep because most of the rest aren't moving. That is the barbell showing up again at the neighborhood level, and it's the clearest evidence in this report that price alone will mislead you.
Roslindale single-family at 1.6 months. Roxbury condo at 9.9. A drive of about ten minutes separates a market where a well-priced house has more buyers than it can handle from a market with the better part of a year's supply on the shelf. Same metro. Same quarter. Same everything, except the thing that matters.
The Core Six
A note before the numbers, because it would be strange to leave it out. Our six core markets closed 534 sales this quarter, down 4.6% year over year, while the broader 145-area region was up 1.9%. Our neighborhoods underperformed the region on volume.
We'd rather explain that than bury it. Four of the six are inventory-constrained, not demand-constrained — Hyde Park and Roslindale in particular are selling almost everything that lists, fast, with very few sellers cutting price. You cannot close sales that never came to market. The other two, Roxbury and Jamaica Plain's condo segment, have a genuine absorption problem. Those are opposite diagnoses that produce the same volume number, and telling them apart is most of the value in this section.
Roslindale — the cleanest seller's market in the report
Roslindale is the only one of our six core markets with volume growth this quarter, and its single-family segment is the tightest market we cover.
The average Roslindale single-family sale crossed $1 million this quarter for the first time in the five-quarter window this data covers. Put that next to 11.9 days to offer, 103.8% of asking, and not one seller cutting price in a month, and you have the cleanest seller's-market story in this report. Thirteen homes are under agreement against eleven on the market. Demand is outrunning supply outright.
Two honest caveats, because a number this good deserves them. First, 28 sales and 11 active listings is a small base — one unusual month would move these figures meaningfully. Second, the trailing-twelve-month median is up 2.6% while the quarterly average is up 10.0%. Both are real. The median is the durable figure; the average is the recent acceleration. Anyone quoting only the 10% is selling you something.
The condo market is a different conversation. Median down 1.6%, inventory at 3.6 months — balanced, not tight. Roslindale is not one market either.
Jamaica Plain — single-family strength against condo saturation
JP has the strongest single-family price growth of our six core markets and the most unsold inventory of any of them.
The tension in Jamaica Plain is the sharpest in the report. Median single-family price is up 9.2%, days to offer is under 16, sellers are getting 103.2% of asking — and half of the active single-family listings have cut their price in the last month.
That is not a contradiction. It's a timing problem. Those 50% priced to spring, when the market was tighter and the comps were newer, and they're now resetting to where the market actually is. The homes that priced correctly are selling in sixteen days above asking. The homes that didn't are the ones cutting. JP's single-family market is rewarding accuracy and punishing optimism, which is a more useful thing to know than any median.
The condo market deserves a flag of its own: days to offer went from 21.9 in Q2 to 31.8 in Q3. Ten days added in a single quarter, in the busiest season. The 2.5% median gain is real but it is trailing data, and the speed number is telling you what comes next.
Somerville — softening on every measure, from a very high base
Every property type in Somerville is down on median price year over year, and it's the one market where the average price genuinely misleads.
Somerville's average sale price reads −0.8%, which sounds like a market that didn't move. The medians read −4.4%, −4.8%, and −7.0%. Every type is down, and the three-type consistency is what makes it credible — a decline in one segment could be mix, a decline in all three in the same direction is a market.
Context matters here more than anywhere else in the report. Somerville single-family is still up 33.6% over eleven quarters. This is a cooling from an extraordinary base, not a collapse, and 4.4–4.7 months of inventory is the textbook definition of a balanced market. Nobody is in trouble. But the direction is unambiguous and a seller who hasn't checked a comp since last year will be surprised.
The one wrinkle: single-family median is down 4.4% while price per square foot is up 8.4%. Those moving in opposite directions is a mix signal — smaller homes are making up a larger share of the twenty sales. With a sample that size, treat the single-family median as directional only.
Also worth recording: 8 Craigie Street sold for $8,750,000 — 42 beds, 18,873 square feet. The largest multifamily trade in any of our core markets this quarter and a useful anchor for any investor conversation about what institutional pricing looks like in Somerville.
West Roxbury — where the average is a mirage
West Roxbury's single-family market is strong and its condo market is not, and the neighborhood average tells you neither.
This is the teaching example for everything the methodology section said about averages.
West Roxbury's condo average reads −3.5% year over year, which looks like a soft quarter. The median reads −6.0%, which looks worse. The reason the average is holding up is that the four highest condo sales in the neighborhood were all on Allandale Road — $2,710,000, $2,200,000, $1,660,000, and $1,620,000. One luxury development is propping up the average for the entire neighborhood's condo market. Strip it out and what remains is a condo market down 6% on median with homes sitting for seven weeks.
Meanwhile the floor of the same neighborhood is a 360-square-foot unit at 116 Spring Street that traded for $191,000. One neighborhood, $191,000 to $2,710,000 — a 14-fold spread in a market most people describe as homogeneous.
Single-family at 2.3 months of inventory and 100.4% of asking is genuinely strong, though the 36% price-cut rate says sellers are still testing above the market before meeting it. Condo at 49.2 days and a declining median is a different market entirely. Two sellers on the same street this autumn need two different conversations.
Hyde Park — a supply problem wearing a demand problem's clothes
Hyde Park's volume fell 22%, and almost every indicator says that's because of what didn't list, not what didn't sell.
Volume down 22% usually means trouble. Here it doesn't, and the three numbers that prove it are the days to offer, the price-cut rate, and the inventory figure.
Condos sold in 16.3 days — down from 38.7 a year ago, a 22-day improvement, the second-largest in our core markets. Six percent of active condos cut their price in the last month, the lowest rate anywhere in the pool. Single-family inventory sits at 2.2 months. That is not a market where buyers disappeared. That is a market where sellers didn't list, and the few who did sold quickly at or above their asking price.
The structural reason is price. Hyde Park's single-family median of $659,500 and condo median of $575,000 sit well below the Jamaica Plain and Roslindale equivalents, and the condo median has climbed 32.2% over eleven quarters — the kind of move that happens when buyers priced out of adjacent markets start looking one neighborhood further out and find that the trains still run.
Flag the one number that doesn't fit: the single-family median is down 5.8% while condos are up 11.7%. With 30 single-family sales and 8 condo sales, neither figure is bulletproof — the condo median in particular rests on a sample we'd normally caveat hard. Treat the condo gain as directional and the single-family dip as probably a mix effect rather than a price decline. We'll know more in January.
Roxbury — the hardest section to write honestly
Roxbury's average sale price is up 39.7% and that number is wrong in every way that matters.
The +39.7% average is the product of three multifamily transactions: 409 Dudley Street at $3,625,000 for a 22-bedroom building, 27 Dudley Street at $3,450,000, and 167 Homestead Street at $3,100,000. Three investor acquisitions in a quarter with 33 total sales will move an average almost anywhere you like. They tell you something real about investor appetite for Roxbury multifamily. They tell you nothing at all about what a condo or a house is worth.
Underneath those three trades, the owner-occupant market has close to ten months of inventory, sellers are taking 97.2% of asking, and a typical listing is waiting 44.5 days for an offer. Multifamily waits 59.2 days. One hundred and six properties are on the market against 28 under agreement.
So the honest advice splits cleanly. If you own a multifamily building in Roxbury, there is active, well-capitalized demand and the recent trades prove it. If you own a condo, you are in the loosest market we track, you should expect to wait, and you should price to the buyer who exists rather than the headline you read. Those sellers are reading the same +39.7% number, and it will cost them months if nobody tells them what's inside it.
Inside Jamaica Plain
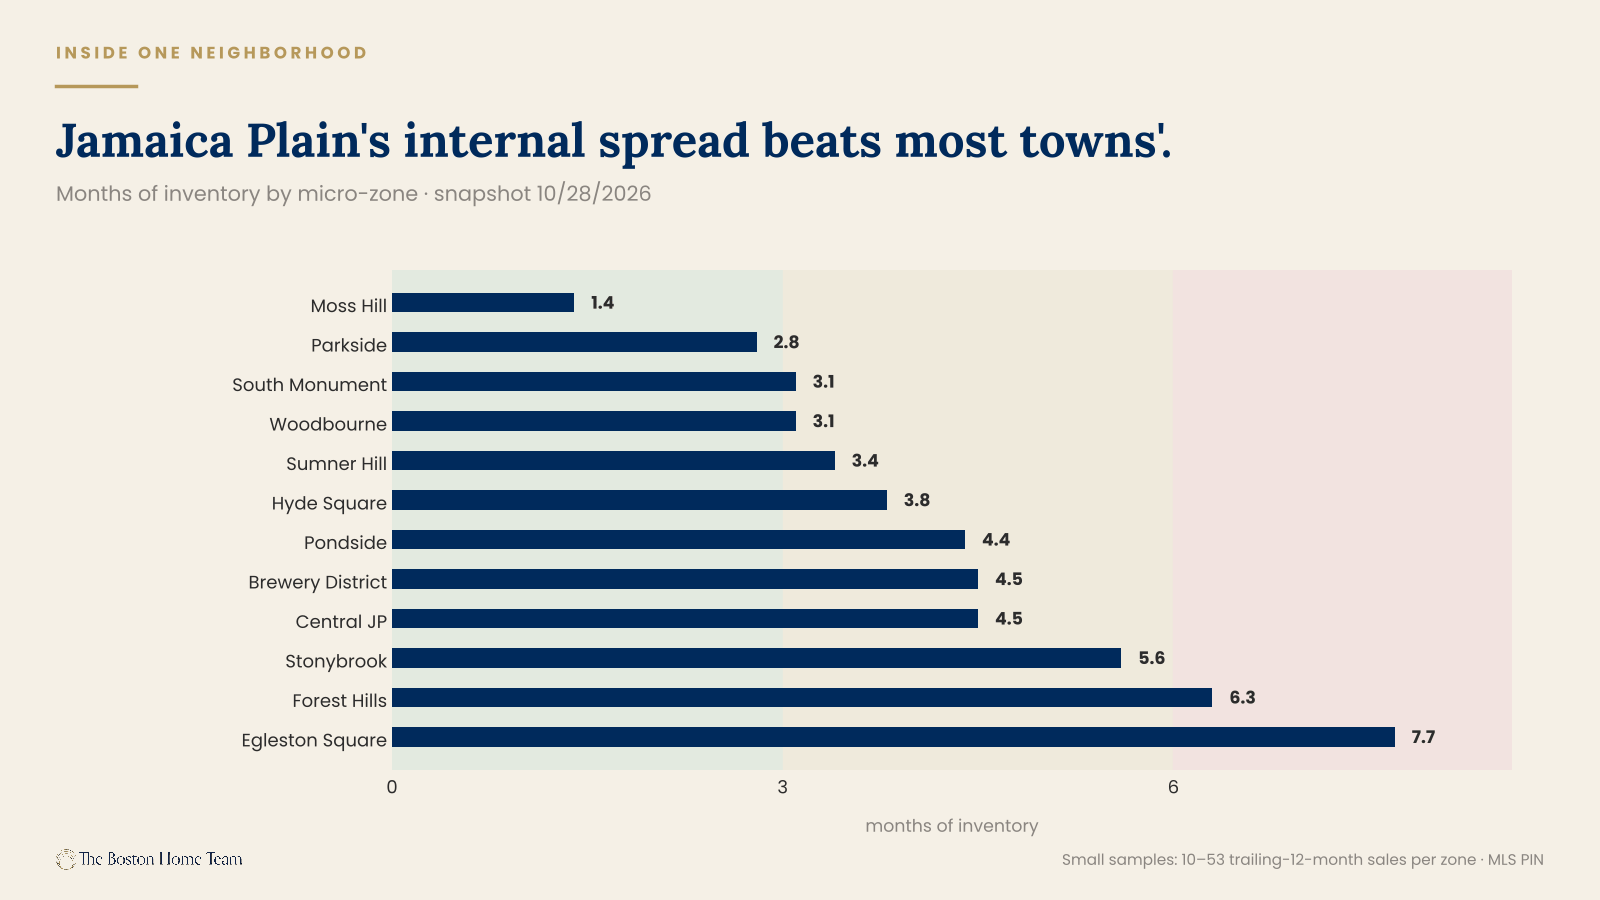
Nobody publishes this. We're going to, because "the JP market" is nearly as useless a phrase as "the Boston market" — and the spread inside one neighborhood turns out to be wider than the spread between most towns.
Zone | MOI | Active | Pending | Condo median (TTM) | YoY |
|---|---|---|---|---|---|
Moss Hill | 1.4 | 3 | 4 | $1,420,000 (SF) | −0.4% |
Parkside | 2.8 | 4 | 5 | $640,000 | −13.5% |
South Monument | 3.1 | 13 | 4 | $775,000 | +14.6% |
Woodbourne | 3.1 | 7 | 3 | $707,500 | −3.1% |
Sumner Hill | 3.4 | 4 | 1 | — | — |
Hyde Square | 3.8 | 17 | 7 | $825,000 | +5.8% |
Pondside | 4.4 | 7 | 3 | $987,000 | +19.6% |
Brewery District | 4.5 | 6 | 0 | $777,304 | +9.5% |
Central JP | 4.5 | 20 | 7 | $853,500 | +6.4% |
Stonybrook | 5.6 | 7 | 5 | $660,000 | −9.9% |
Forest Hills | 6.3 | 11 | 6 | $685,000 | +3.0% |
Egleston Square | 7.7 | 9 | 6 | $715,500 | −1.6% |
Snapshot 10/28/2026. All zones are small samples — see the caveat below.
Every one of these is a small sample. Ten to fifty-three trailing-twelve-month sales per zone. Individually fragile, directionally useful, and we would not price a listing off any single row without pulling the comps underneath it. Read them as a pattern, not as appraisals.
The pattern is striking. Pondside condos are up 19.6% and Parkside condos are down 13.5% — same neighborhood, same year, roughly a mile apart. South Monument is up 14.6% while Stonybrook is down 9.9%. And the gap between the tightest zone, Moss Hill at 1.4 months, and the loosest, Egleston Square at 7.7, is wider than the gap between most of the towns in this report.
A few other micro-zones worth having on the record, all small samples:
- Roxbury Fort Hill — 4.1 months of inventory, condo median $550,000, −12.7%
- West Roxbury Bellevue Hill — 3.8 months, single-family median $1,117,500, −4.9%
- Hyde Park Fairmount Hill — 0.5 months, single-family median $792,500, +8.2%
- Roslindale Peters Hill — zero active listings against two pending. Months of inventory 0.0.
Peters Hill with nothing for sale and two homes under agreement is the single most extreme reading in this dataset, and it is exactly the kind of fact that a neighborhood-level average would erase completely.
Regional divergence
We use county exactly once in this report, here, because there's one county-level story the neighborhood data can't tell.
County | Q3 sales | Vol QoQ | Vol YoY | Avg price (YoY) | $/sqft (YoY) | DTO (vs LY) | Sale-to-list |
|---|---|---|---|---|---|---|---|
Essex | 2,212 | +21.2% | +8.7% | $825,107 (+0.6%) | $416 (+3.5%) | 23.6 (21.5) | 101.22% |
Middlesex | 4,154 | +2.2% | +1.5% | $1,019,046 (0.0%) | $470 (+0.2%) | 24.4 (22.7) | 101.11% |
Norfolk | 2,020 | +10.2% | +1.0% | $1,029,525 (+2.7%) | $462 (+0.2%) | 24.5 (23.7) | 100.80% |
Suffolk | 1,570 | −0.8% | −4.6% | $1,121,539 (+7.9%) | $754 (+4.5%) | 36.7 (33.6) | 98.65% |
Swipe horizontally to see the full table.
The North Shore is absorbing the region's demand
Essex County closed 8.7% more sales than last year — more than four times the regional rate — and 21.2% more than last quarter. The individual markets back it up. Beverly condos: 61 sales, up 154% year over year, median $540,000 (+20.0%), 1.4 months of inventory, and the highest growth score in our entire pool at +0.183. Marblehead single-family: price per square foot up 17.6%, median $1,132,500, up 10.0%. Salem, Peabody, and Danvers are all tight.
At an average of $825,107 against Suffolk's $1,121,539, Essex is where roughly $300,000 of price difference buys a commute. A meaningful number of buyers made that trade this summer, and the volume data shows exactly where they landed.
Suffolk is the paradox and deserves careful reading
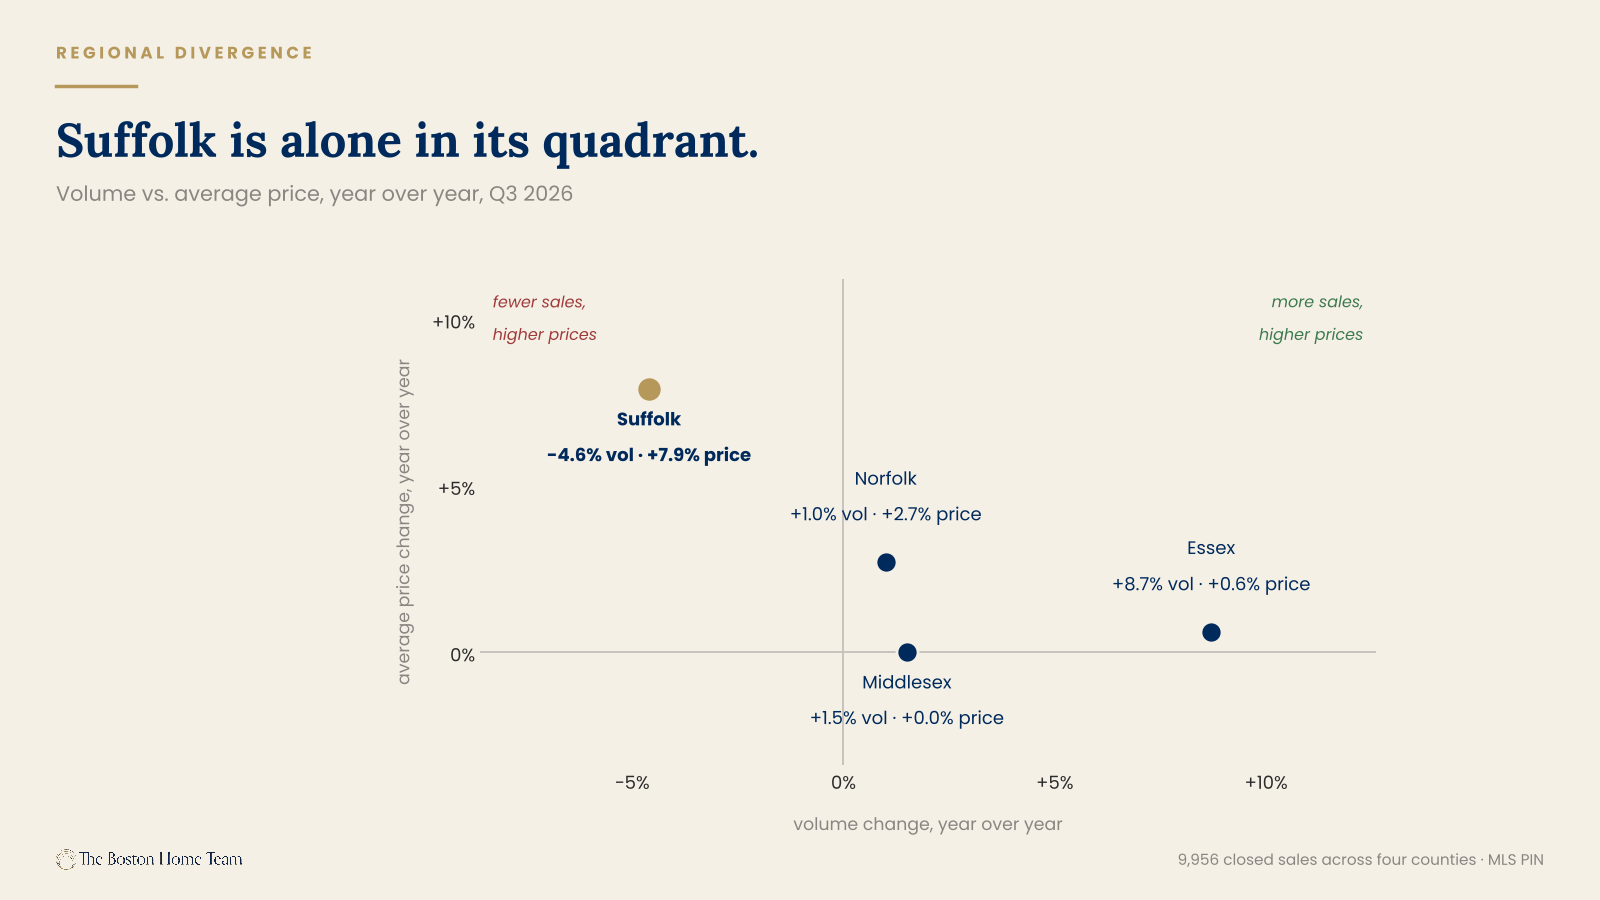
It is the only county with declining volume, at −4.6%, and simultaneously posts the strongest price growth in the region: +7.9% on average price, +4.5% on price per square foot. Those two facts are not in tension. They are the same fact. Fewer transactions, concentrated at the top of the market, pull the average up without any individual home being worth more. Beacon Hill price per square foot is up 16.0%; Back Bay penthouses are trading between $3,000 and $4,700 per square foot.
Then look at the rest of Suffolk's row. Days to offer at 36.7 — ten days slower than the regional average. Sale-to-list at 98.65%, the only county in the region below par. High prices, slow market, few trades, sellers taking less than ask.
That is not strength. That is a thin market at the top doing the arithmetic work, and the mix effect should be stated out loud every single time somebody quotes Suffolk's +7.9%.
Where sellers lost
The luxury-town stall is the most underreported story of the quarter.
Market | Sales | DTO (vs LY) | Days added | Sale-to-list | Volume YoY | Growth score |
|---|---|---|---|---|---|---|
Weston SF | 32 | 67.9 (36.7) | +31.2 | 96.0% | −15.8% | −0.164 |
Brookline SF | 25 | 57.5 (36.2) | +21.3 | 96.7% | −37.5% | −0.221 |
Westwood SF | 37 | 54.1 (22.5) | +31.6 | 100.2% | −14.0% | −0.122 |
Charlestown SF | 14 | 53.9 (9.2) | +44.7 | 100.9% | +40.0% | +0.031 |
Lexington SF | 96 | 39.4 (21.7) | +17.6 | 99.9% | −9.4% | −0.118 |
Lexington CC | 10 | 44.6 (16.9) | +27.7 | 99.5% | −23.1% | −0.138 |
Swipe horizontally to see the full table.
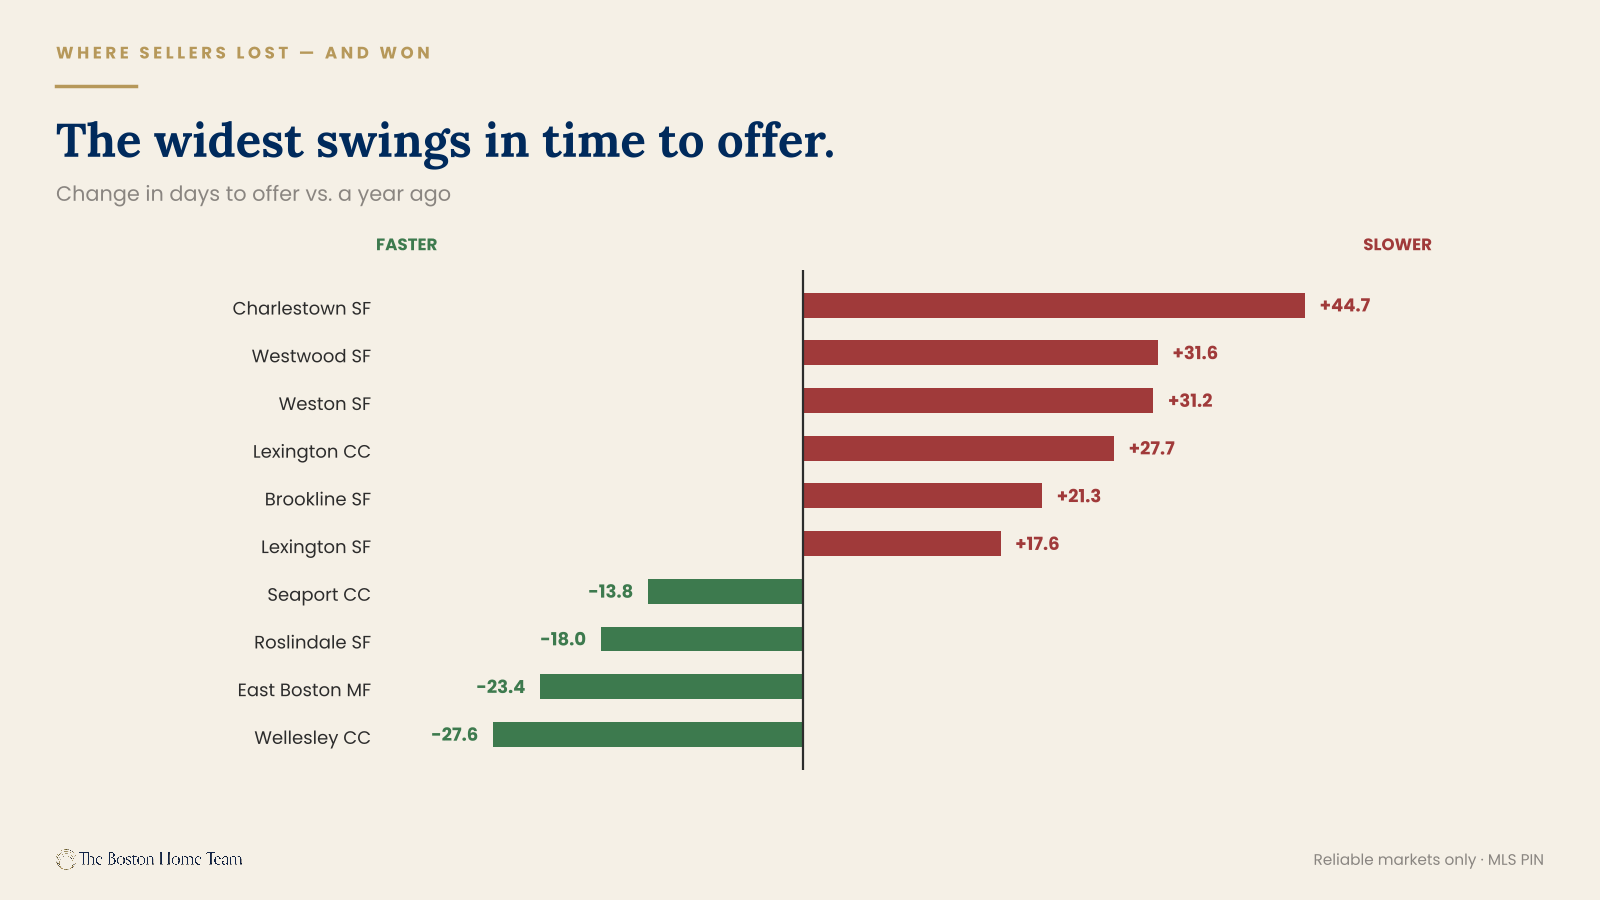
Brookline single-family is the worst-performing reliable market in our pool. Growth score −0.221, volume down 37.5%, 57.5 days to offer, sellers taking 96.7% of asking, price per square foot down 11.8%. Every measure moved the wrong way at once, which is rare and which makes it credible.
Charlestown single-family posted the largest single-year deterioration in the dataset: 9.2 days to offer last year, 53.9 this year. A 44.7-day swing. But read it carefully before you call it a collapse — volume is up 40% and price per square foot is up 9.1%. More homes sold, for more money, much more slowly. Charlestown didn't weaken. It stopped being instant, and a market that was instant has nowhere to go but slower.
That distinction matters for every market on this table. Weston at 67.9 days with sellers taking 96% of ask is a real repricing. Westwood adding 31.6 days while holding 100.2% of ask is a market finding its level. Same column, different diagnoses.
And the other direction
- Wellesley condos: 57.7 days to 30.1 (−27.6)
- East Boston multifamily: 49.1 to 25.6 (−23.4)
- Roslindale single-family: 29.9 to 11.9 (−18.0)
- Seaport condos: 62.2 to 48.4 (−13.8)
Wellesley condos cutting time to offer nearly in half, in a town whose single-family market is slowing, is the barbell again in miniature: the move-down buyer at $900K to $1.2M is the most reliable demand in this region right now, and the markets that have product at that price are clearing it.
The record book
The quarter's extremes, because somebody always asks.
Top five sales, Q3 2026
# | Property | Price | Detail | Closed |
|---|---|---|---|---|
1 | 46 Beacon St, Unit PH8 (Beacon Hill) | $18,000,000 | 4 bd · 5,740 sqft · $3,136/sqft | Jul 24 |
2 | 430 Stuart St, Unit PH35B (Back Bay) | $14,250,000 | 3 bd · 3,041 sqft · $4,686/sqft | Aug 20 |
3 | 510 Willard St (Quincy) | $13,500,000 | 68-unit multifamily · 36,202 sqft | Jul 22 |
4 | 46 Beacon St, Unit PH7 (Beacon Hill) | $12,500,000 | 3 bd · 3,557 sqft | Aug 4 |
5 | 292 Marlborough St (Back Bay) | $10,500,000 | 5 bd · 5,691 sqft | Jul 1 |
Swipe horizontally to see the full table.
Campion & Company listed four of the region's ten largest sales. One building, 46 Beacon Street, produced three of them.
The floor: 2 Merrill Avenue in Hamilton — $55,000 for a 585-square-foot single-family home, closed September 18.
Widest price spread inside a single market
$122K – $14.25M
$191K – $2.71M
Tightest spreads: Avon at 1.6x ($575,000 to $900,000), Dunstable 1.7x, Carlisle 2.1x. Three towns where essentially every home is the same home, statistically speaking.
The $5M+ club, by town: Back Bay 5, Beacon Hill 5, Wellesley 5, Cambridge 4, Newton 3, Downtown 2, Marblehead 2, South End 2, Weston 2.
The affordability floor: 58 sales closed under $300,000 across our 65-area pool this quarter. Almost all of them were micro-units — 137 square feet at 425 Newbury Street for $122,000; 180 square feet in Downtown for $145,000; 236 square feet at 3 Goodwin Place on Beacon Hill for $299,000. An entry point into Boston proper exists. It is just very, very small.
Top sale in each of our core markets
Neighborhood | Address | Price | Notes |
|---|---|---|---|
Somerville | 8 Craigie Street | $8,750,000 | 42-unit multifamily |
Roxbury | 409 Dudley Street | $3,625,000 | 22-bed multifamily |
Jamaica Plain | 45 Parley Avenue | $3,172,425 | 6 bd · 6,440 sqft · listed by LandVest |
West Roxbury | 202 Allandale Road, Unit B | $2,710,000 | — |
Roslindale | 3965 Washington Street | $2,100,000 | 12-bed multifamily |
Hyde Park | 1420 River Street | $1,235,000 | 6-bed multifamily |
Swipe horizontally to see the full table.
Four of our six core markets had a multifamily building as their top sale. That is itself a finding — in the neighborhoods we work, the ceiling is set by investors, not by houses.
What Q4 looks like
One forecast, three signals, and a seasonal baseline we don't think holds.
The baseline
Measure | Q3 2025 | Q4 2025 | Change |
|---|---|---|---|
Closed sales | 9,772 | 8,400 | −14.0% |
Average price | $977,912 | $967,303 | −1.1% |
Days to offer | 24.5 | 30.2 | +5.7 days |
Last year's seasonal transition.
Run that pattern forward and Q4 2026 lands near 8,500 sales with days to offer pushing into the low 30s.
We'd take the under
Here is the one piece of real speculation in this report, stated plainly so you can hold us to it in January: this is not an ordinary autumn, and the seasonal baseline above understates what's coming. The reason is the thing that didn't appear anywhere in the Q3 sales data, because it happened after the quarter closed.
30-year fixed | A year ago | Now | Change |
|---|---|---|---|
Mortgage News Daily (daily) | 6.13% (Oct 28, 2025) | 7.35% (Oct 28, 2026) | +1.22 pts |
Freddie Mac (weekly) | 6.27% | 7.32% (Oct 22, 2026) | +1.05 pts |
Mortgage Bankers Assn (weekly) | 6.42% | 7.41% (Oct 21, 2026) | +0.99 pts |
Three surveys, three methodologies, one direction.
The path matters as much as the level: rates bottomed just under 6% in late winter, climbed through the spring and summer, and then moved hard in late September and the first half of October, touching the mid-7s before easing back to where they sit today.
Which means the buyers who created this report's Q3 numbers were shopping at roughly 6.4% to 6.9%. The buyers in the market right now are shopping at 7.35%. The quarter we just measured was financed at a price that no longer exists.
What that costs, in dollars
On the region's average home ($994,246, 20% down) | Rate | Monthly P&I |
|---|---|---|
A year ago | 6.13% | $4,836 |
Q3 2026, at time of agreement (est.) | ~6.75% | $5,159 |
Today | 7.35% | $5,481 |
Principal and interest only; excludes taxes, insurance and MI.
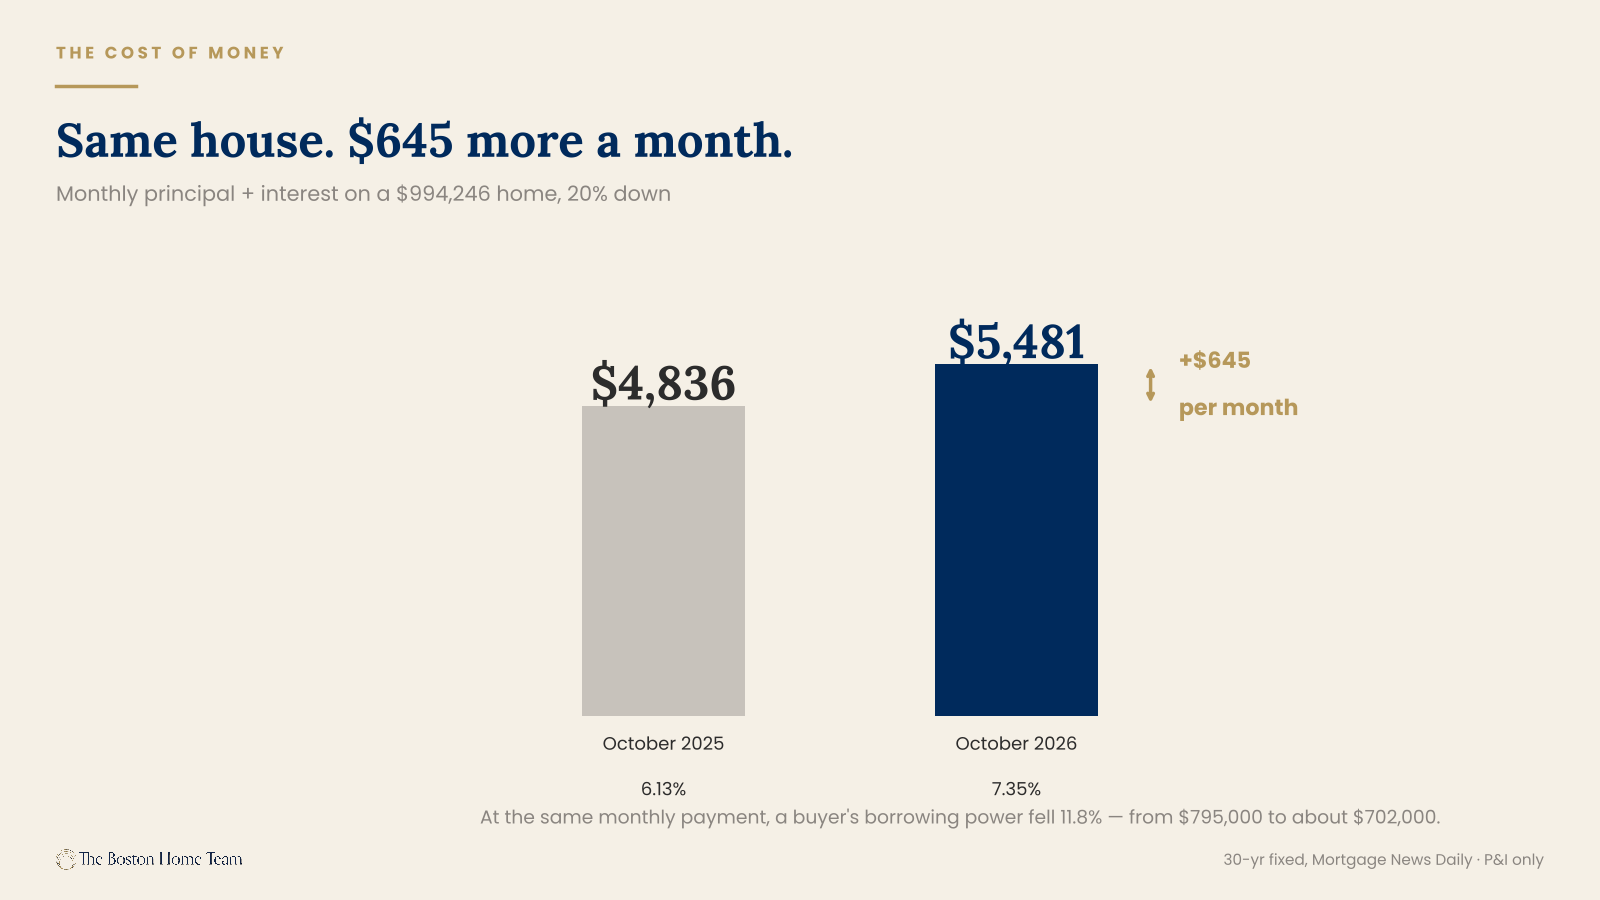
$645 a month more than a year ago, for the exact same house. Put the other way around: the monthly payment that financed a $795,000 mortgage last October finances about $702,000 today. Same budget, 11.8% less borrowing power, in twelve months.
That is the entire argument for taking the under. Last year's 14% seasonal step-down happened on roughly 6.3% money. This year's seasonal step-down happens on 7.35% money, and it lands on a market that was already decelerating during its strongest quarter — sale-to-list fell from 101.77% in Q2 to 100.68% in Q3, days to offer rose to 26.2, and 87 segments carry a cooling flag against 63 strengthening.
Seasonality explains an autumn slowdown. It does not explain a summer one. The summer one already happened, and Q4 stacks the seasonal decline on top of a rate shock rather than instead of one.
So the honest expectation is a volume decline steeper than 14% and days to offer moving past the low 30s rather than settling into them. We'd rather be wrong out loud than publish a seasonal average and call it analysis.
Signal one: price cuts are running hot in tight markets
Market | Price cuts, 30d | Months of inventory | Active |
|---|---|---|---|
Medford SF | 51% | 2.7 | 45 |
Jamaica Plain SF | 50% | 3.0 | 18 |
Waltham MF | 50% | 7.8 | 22 |
Peabody CC | 47% | 2.6 | 19 |
Waltham SF | 45% | 2.8 | 44 |
Belmont SF | 44% | 2.4 | 25 |
Braintree SF | 44% | 1.9 | 39 |
Markets with 15+ active listings.
Look at the inventory column. Braintree single-family is at 1.9 months — one of the tightest markets in the region — with 44% of active sellers cutting price. Belmont is at 2.4 months with 44% cutting. Medford is at 2.7 with 51% cutting.
That is an overpricing problem, not a demand problem. Those sellers anchored to spring comps. The buyers didn't leave — in a 1.9-month market, the buyers are right there. The asking prices went somewhere the buyers wouldn't follow, and then came back.
Signal two: the bottom of the price-cut table is where the real strength is
Hyde Park condos at 6%, Milton condos at 7%, Back Bay condos at 11%, Seaport condos at 11%, and Roslindale single-family at 0%. A low price-cut rate in a market with inventory means sellers priced it right the first time. That's the number we watch most closely going into a slower season.
Signal three: the $900K–$1.2M band
It was the only band that got faster this year, it has the best sale-to-list in the region, and it's the only one with real volume growth. If it holds through Q4, it confirms the barbell is structural rather than a one-quarter artifact. If it softens, the whole market is softening and we'll say so in January.
One honest counterweight
Because this is a forecast and forecasts deserve their opposition: rates eased from the mid-7s back to 7.35% over the past two weeks. If that continues, the picture changes quickly — the demand that fell out of qualification this autumn is not gone, it's priced out, and priced-out buyers come back fast when the payment works again. Every seller we're advising right now is being told the same thing: the question isn't whether buyers exist, it's what they can afford this month.
And then the number this report opened with. Roslindale single-family at 1.6 months of inventory. Roxbury condominiums at 9.9. Three miles. Nothing in the Q4 data is likely to close that gap, which means every piece of advice in this document has to start with the same question: which market are you actually in? Not which city. Which market.
Frequently asked questions
Is Greater Boston a buyer's market or a seller's market right now?
Both, depending on your block. Across our 65-area pool as of October 28, 2026: 29 markets are seller's markets (under 3 months of inventory), 22 are balanced, and 10 are buyer's markets (6+ months). Single-family is the strongest — zero single-family markets in the pool are in buyer's territory. Condos are the weakest, with 10 in buyer's territory.
Did home prices go up or down in Q3 2026?
Up slightly. The volume-weighted average sale price across 145 Greater Boston towns was $994,246, up 1.7% year over year, with price per square foot at $501, up 1.1%. Speed is the number that moved against sellers: days to offer rose from 24.5 to 26.2, and sale-to-list fell to 100.68% from 101.77% in Q2.
How many homes sold in Greater Boston in Q3 2026?
9,956 closed sales across 145 cities, towns, and Boston neighborhoods between July 1 and September 30, 2026. That's up 1.9% from 9,772 in Q3 2025 and up 7.0% from Q2 2026. Single-family accounted for 5,659, condos 3,525, and multifamily 772.
What is the median home price in Jamaica Plain?
As of the twelve months ending Q3 2026, the median single-family sale in Jamaica Plain was $1,420,000, up 9.2% year over year — the strongest median gain in our core markets. The median condo was $749,500, up 2.5%. Single-family homes sold in 15.6 days at 103.2% of asking.
How long does it take to sell a house in Roslindale?
11.9 days to offer for single-family homes in Q3 2026, down from 29.9 a year ago. Roslindale single-family also runs 1.6 months of inventory, sale-to-list of 103.8%, and a 0% price-cut rate over the last 30 days. It is the tightest single-family market we track.
Are Boston condo prices going down?
In the neighborhoods, yes — slightly. Outside the downtown core, condo price per square foot fell 1.6% year over year and average price slipped 0.4%. Downtown core condos went the other way, up 5.6% on average price. That's a reversal of the 2021–2023 pattern, when downtown lagged and the neighborhoods appreciated.
Which Boston neighborhoods have the most inventory right now?
Roxbury condos lead at 9.9 months of inventory, followed by Allston condos (8.8), Seaport (8.4), West End (8.2), Fenway (7.4) and Downtown (7.2). Fenway is the outlier worth knowing about: 45 active condo listings and zero pending as of October 28, 2026.
What's the best-performing neighborhood in Greater Boston right now?
Two answers. Roslindale has the strongest fundamentals of our core markets — 1.6 months of inventory, 11.9 days to offer, 103.8% of asking, no price cuts, and the only volume growth among the six. Regionally, Beverly posts the highest growth score in our pool (+0.183) on condo volume up 154% year over year.
Is now a good time to sell a multifamily property in Boston?
It depends on the buyer you need. Multifamily volume is up 4.2% year over year because investors are active, but median price is down 0.3% and price per square foot is down 2.1%. Multifamily carries the highest inventory of any type at 4.7 months, with 7 of 23 tracked markets in buyer's territory. Expect a disciplined buyer and a longer timeline.
What's happening to luxury home prices in Boston?
Luxury is slower than the headline suggests. Homes above $1.8 million posted the strongest price-per-square-foot growth of any band at +4.0%, but also the largest increase in days to offer (+4.5 days, to 35.6) and a sale-to-list of 99.46% — below asking. Rising price per square foot alongside falling speed is selection, not strength: the best properties trade and the rest sit.
What mortgage rate are Boston buyers actually getting right now?
As of October 28, 2026, the 30-year fixed conforming rate is 7.35% (Mortgage News Daily daily index), against 6.13% a year ago. Jumbo runs higher at 7.60%. In Suffolk, Middlesex, Norfolk and Essex counties the 2026 conforming loan limit is $962,550, which at 20% down corresponds to a purchase price of about $1,203,188.
What our clients say
“BJ presented a thorough analysis of the market, gave expert advice on physical improvements to make, and marketed the listing successfully. The house sold within one week at a price 10% higher than we thought we would receive — all during a recession.”
“When the Fed began to raise rates, we began to panic. The team pivoted quickly, sped up our timeline, and strategized a listing plan that would drive interest fast. Their knowledge of the market led to multiple offers above our expectations with only one open house.”
“BJ sold our house in JP in two days with multiple offers. They handled everything seamlessly — showings, analyzing offers, hooking me up with a closing attorney, even coordinating inspectors while I was out of town. Complete confidence in this team.”
“BJ and Meredith provided caring and professional service on the sale of my home under extraordinary circumstances. They recommended and arranged all the services needed, and remained involved and responsive from the time offers were in hand all the way until closing.”
Which market are you actually in?
This report covers 145 towns, and the honest answer for your home is probably not on any of these tables. Months of inventory, days to offer, and the price-cut rate on your street are all things we can pull in an afternoon — for your block, your price band, your property type.
We’re watching every listing that hits the MLS in our core markets. If you’re thinking about 2027, the useful conversation starts now, while there’s still time to do something with the answer.
Data sources and methodology. Sales data: MLS PIN closed transactions, July 1 — September 30, 2026, across 145 Greater Boston cities, towns, and neighborhoods, compared against the same period in 2025. Inventory, months of inventory, pending counts, absorption rates, and price-cut rates: MLS PIN market snapshot dated October 28, 2026, with sales counted through October 27, 2026. These are two separate data vintages and are reported separately throughout.
Median prices are trailing-twelve-month figures (the twelve months ending Q3 2026 against the twelve months ending Q3 2025) and smooth more than a quarter-over-quarter comparison. Average prices are quarter-specific. Where the two disagree, we report both and say which we trust.
Months of inventory thresholds: under 3 months indicates a seller’s market, 3–6 balanced, 6 or more a buyer’s market. “Days to offer” measures the time from list date to accepted offer and is distinct from days on market for active listings, which is biased toward properties that haven’t sold. The two are never combined in this report.
Segments with fewer than 10 transactions are flagged in the text. Segments with fewer than 5 are reported as transaction counts only, without pricing figures. 138 of 372 area-and-property-type segments in the source data carry a thin-sample flag; 82 are flagged very thin.
Micro-zone data is drawn from 10–53 trailing-twelve-month sales per zone and is directionally useful but individually fragile. We would not price a property from a micro-zone figure without pulling the underlying comparables.
Mortgage rate data: Mortgage News Daily 30-year fixed daily index (conforming 7.35% and jumbo 7.60%, October 2026; conforming 6.13%, October 28, 2025), with Freddie Mac Primary Mortgage Market Survey (7.32%, week of October 22, 2026) and Mortgage Bankers Association weekly survey (7.41%, week of October 21, 2026) shown for comparison. The three surveys differ in methodology and point convention — the MBA figure carries 0.75 discount points while the Freddie Mac figure carries none, which accounts for most of the spread between them. Rates cited for the period during which Q3 transactions went under agreement are approximate, read from the published rate history rather than from individual locks. Payment figures are principal and interest only, calculated on a 30-year amortization at the stated rate and down payment, and exclude taxes, insurance, and any mortgage insurance. 2026 conforming loan limits per FHFA county schedules for Suffolk, Middlesex, Norfolk and Essex counties.
Prepared by The Boston Home Team at Gibson Sotheby’s International Realty. Published October 28, 2026.