When the fall market goes under agreement in Jamaica Plain and Roslindale
What happens during the fall every year? Why is the fall market window so much smaller than the spring market? Does it make sense to list in November? When does it make sense to wait until after the holidays? This year things seem to be pretty stark in terms of what the data is telling us. Open house attendance, offer numbers, and general activity has gone quiet in October. Here's some data for us to parse through.
Accepted-offer dates for every closed single-family and condo sale in JP and Roslindale, fall 2015 through fall 2025. Each year’s weeks are lined up on Labor Day, then labeled with the matching 2026 dates, so “Sep 14” means the week after Labor Day in any year.
This is the week of Oct 19
In past years this week sits on the “second shelf”: about four weeks left at roughly 80% of the September pace before the Thanksgiving drop.
Four phases, and they arrive on the same schedule most years
About 5.5 accepted offers, the slowest week of the fall. New listings launch that week and the offers land the next.
About 17.2 accepted offers a week, 90% of the average spring week. Offers come in around 7–10 days on market, and Sep 14 and Sep 21 are the only weeks with median sales over asking.
About 13.8 a week, 80% of peak. Volume holds, but listings take 10–18 days to get an offer and sell at asking or just under.
Thanksgiving week cuts volume to about 8.6 a week, 50% of peak. In the last two weeks of December it falls under 5 a week, and the offers that do come are on listings 3–8 weeks old.
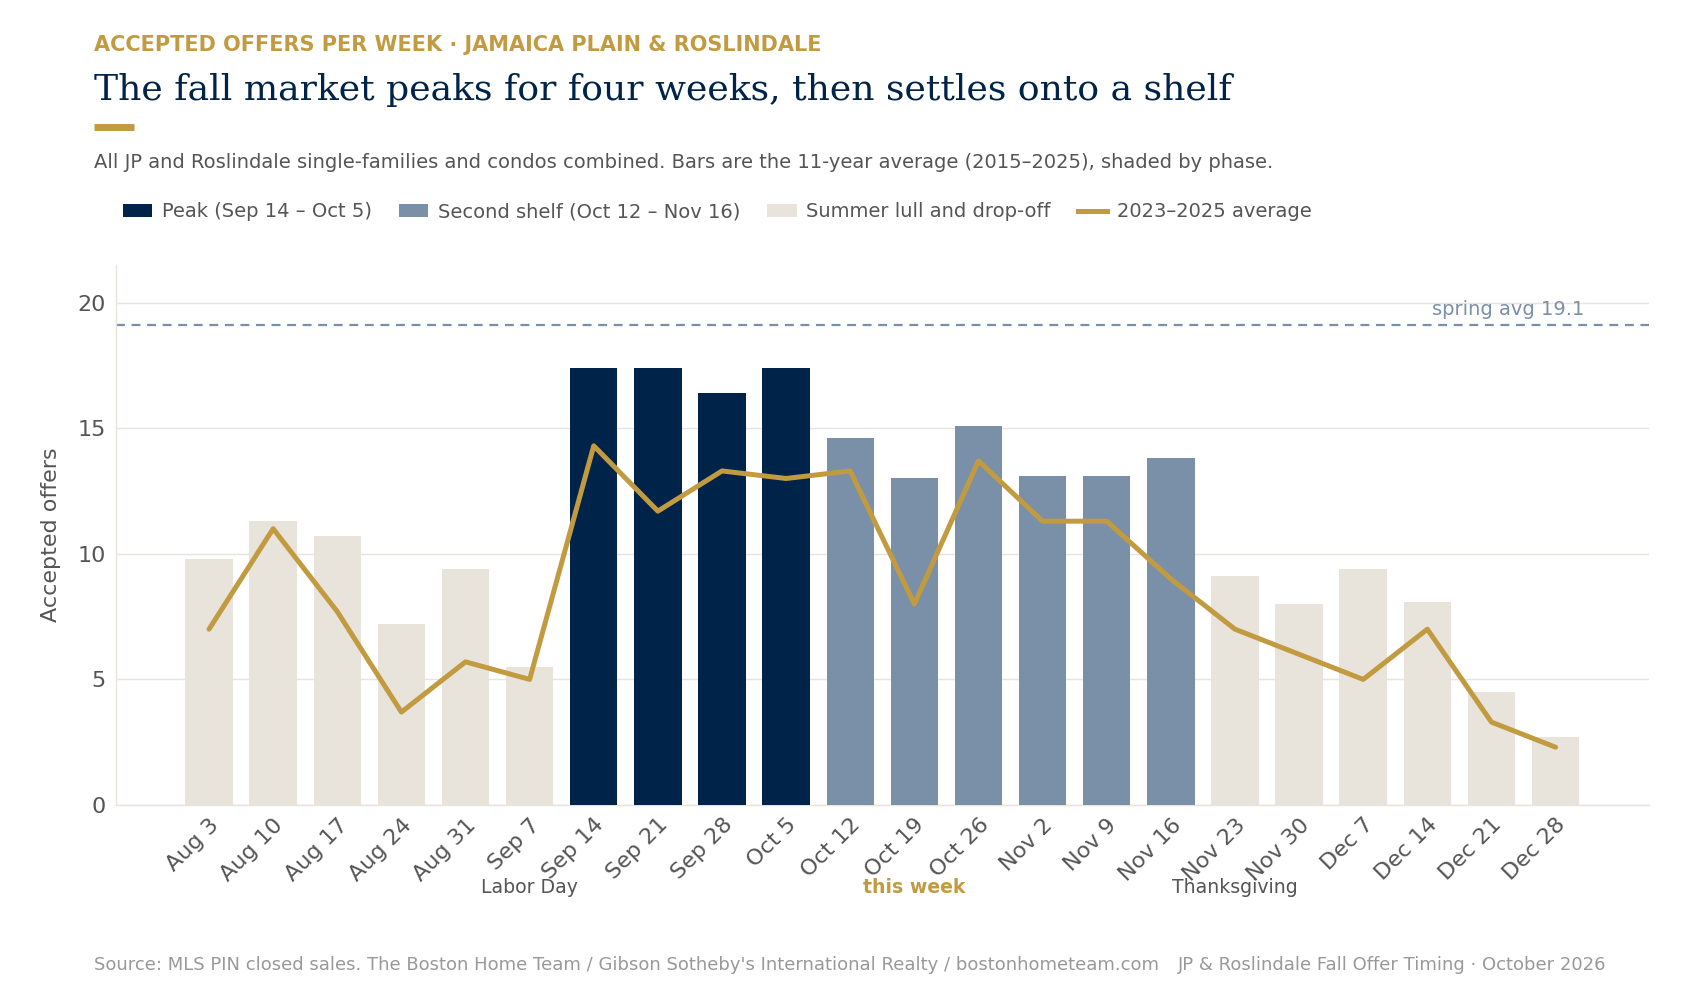
Accepted offers per week, all JP and Roslindale single-families and condos combined. Bars are the 11-year average (2015–2025), shaded by phase. The gold line is the last three falls. The dashed line is that segment’s average spring week, mid-April to mid-June.
The last three falls are smaller and flatter
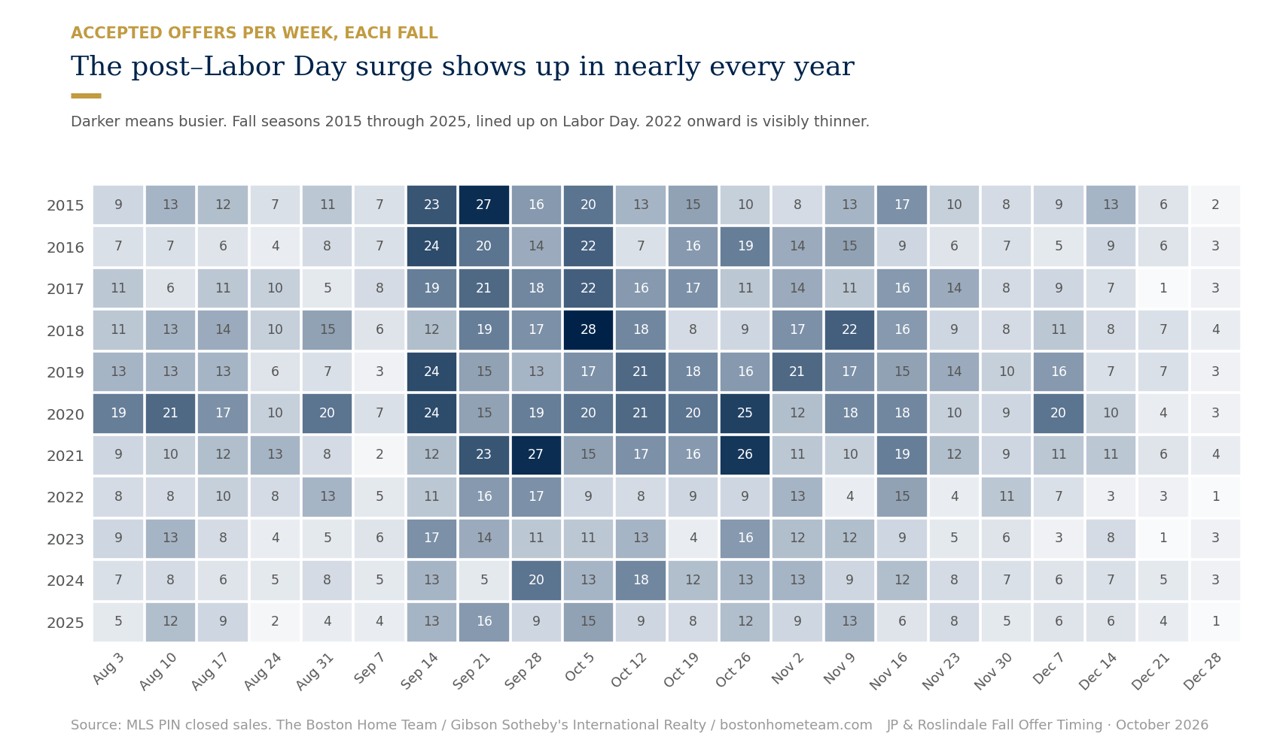
2023–2025 ran about 13.2 accepted offers a week at peak, against 17.1 long-run. The September burst is weaker and the plateau stretches into late October, but the Thanksgiving drop still arrives on schedule.
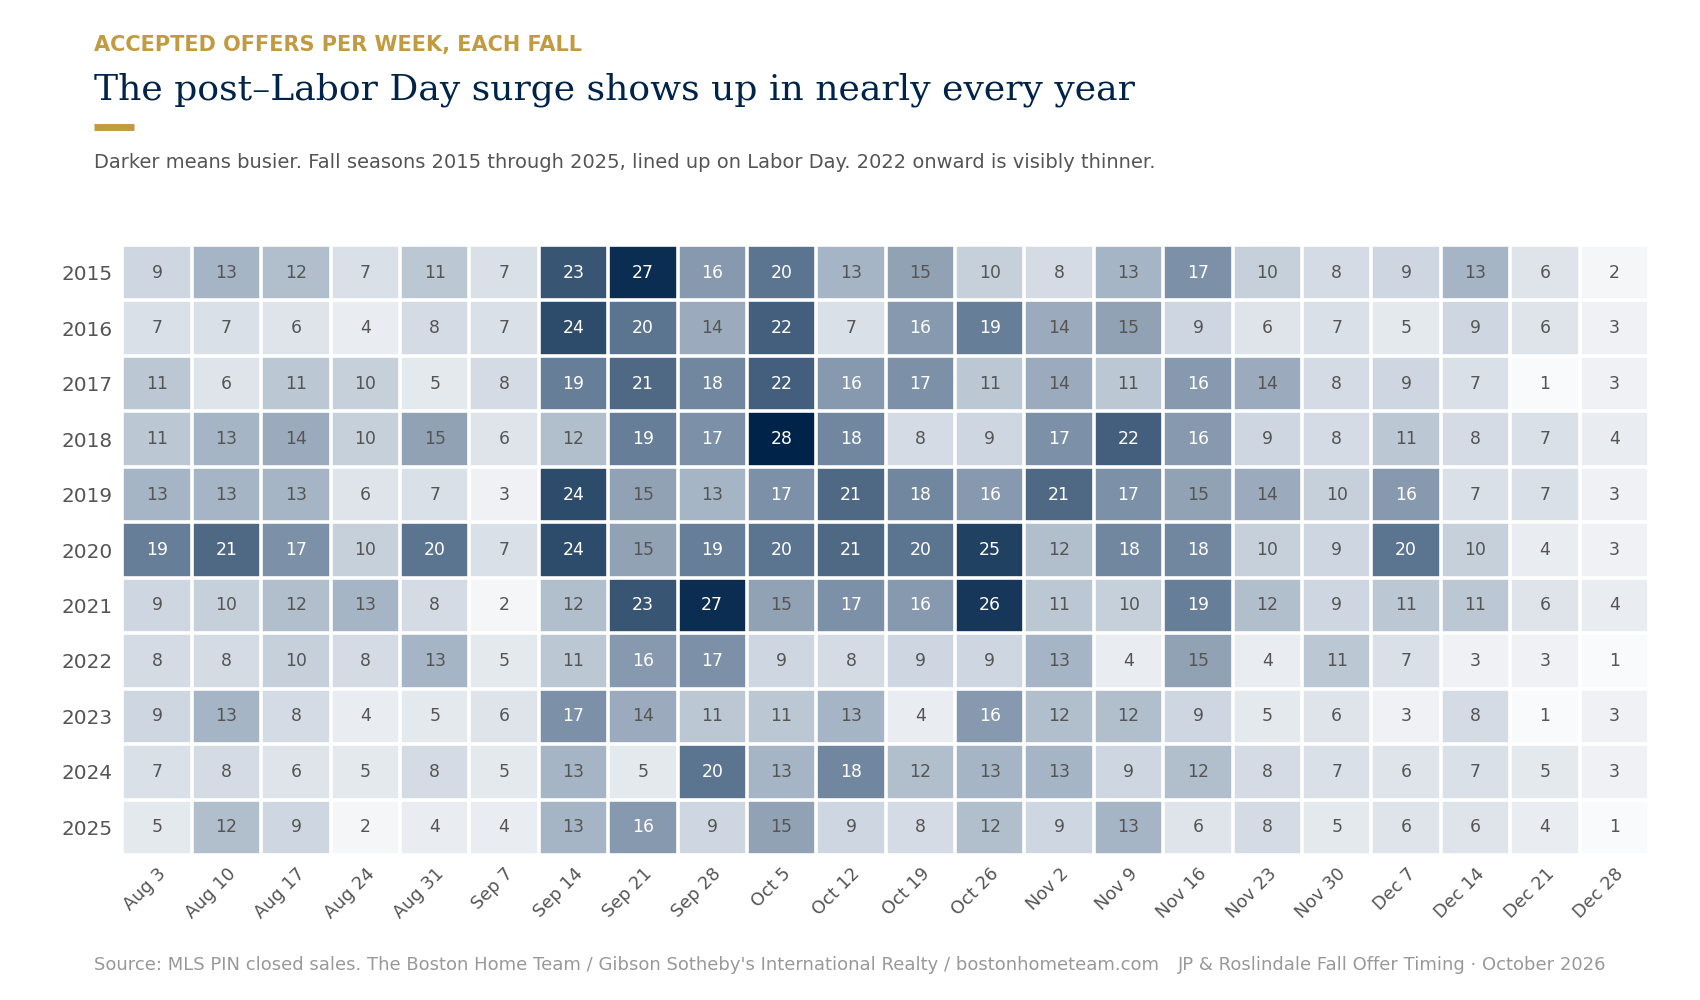
Accepted offers per week, each fall from 2015 through 2025. Darker means busier. 2022 onward is visibly thinner.
What a listing waits, and what it gets
In the peak weeks the median listing goes under agreement in 7 to 10 days. On the second shelf that stretches to 10 to 18 days. The week of Nov 30 is the outlier: a median of 42.5 days to offer and 98.3% of asking, because the listings still trading that week are the ones that have been sitting.
Sale-to-list tells the same story in a narrower band. Sep 14 and Sep 21 are the only two weeks of the fall with median sales over asking, at 101.0% and 101.5%. Everything from Oct 26 forward sits at asking or below.
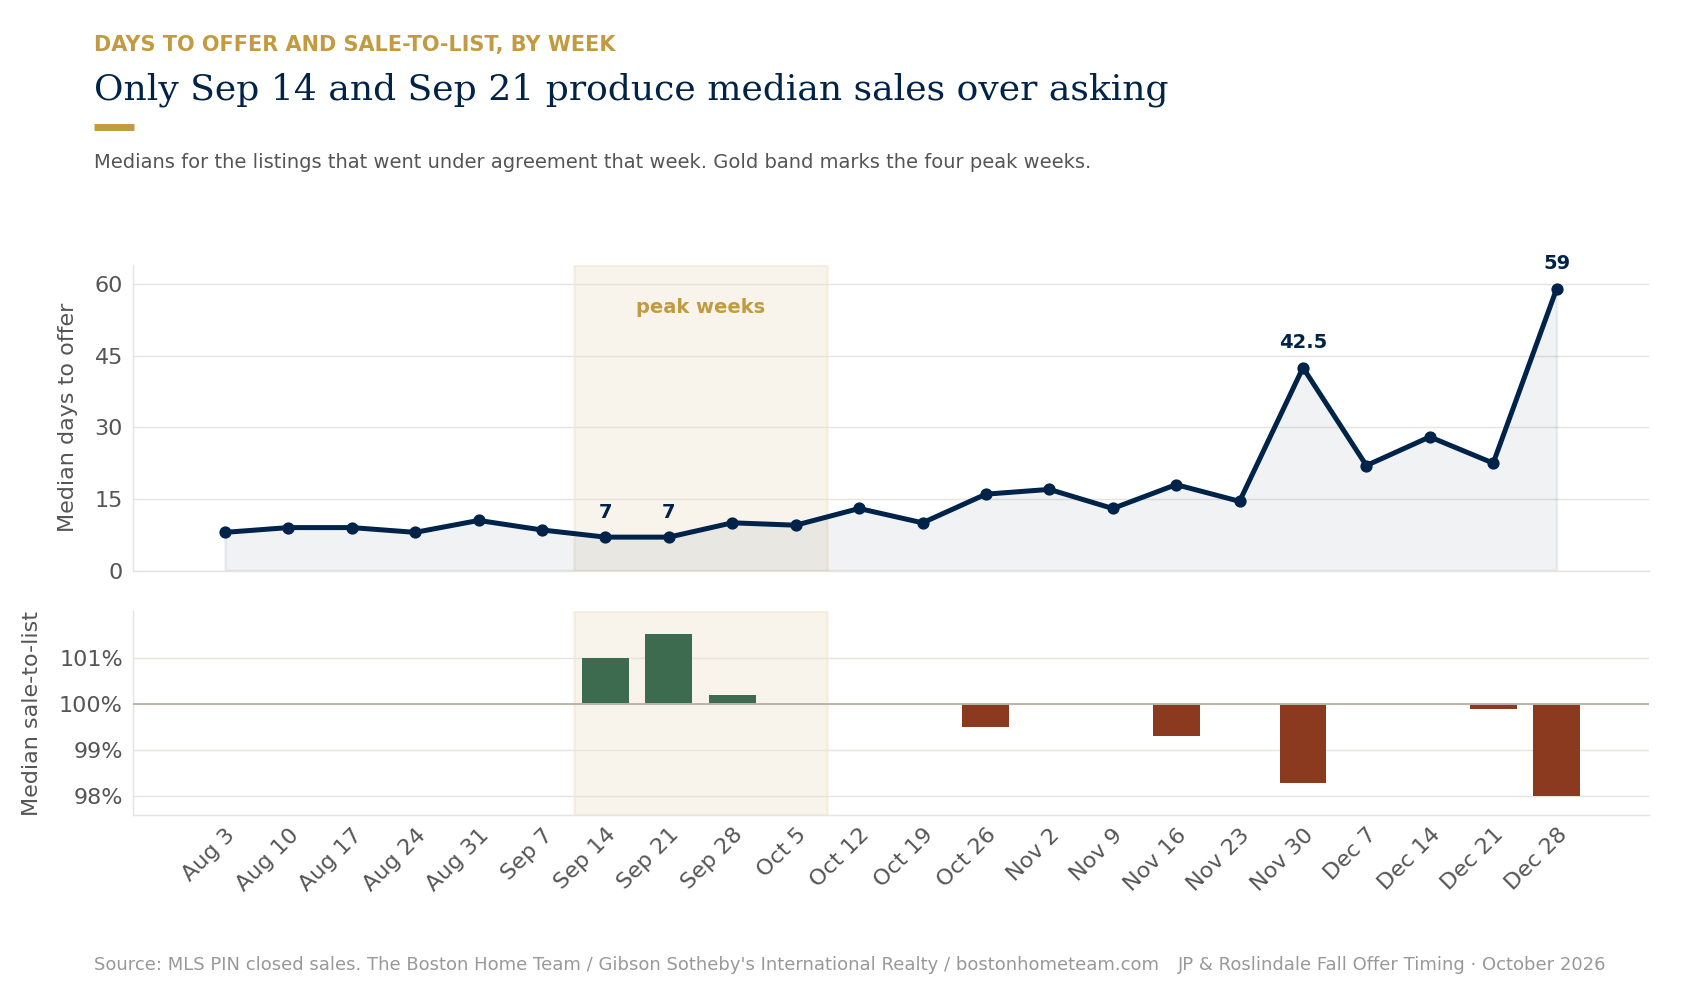
Median days to offer and median sale-to-list ratio by week, for the listings that went under agreement that week. The gold band marks the four peak weeks.
Sep 21 lands in the top three more often than any other week
Counting each fall separately, the week of Sep 21 ranked among that year’s three busiest weeks in 8 of 11 falls. Sep 14 did it in 7, Oct 5 in 6. Labor Day week and the week of Oct 19 never once made a top three in eleven years.
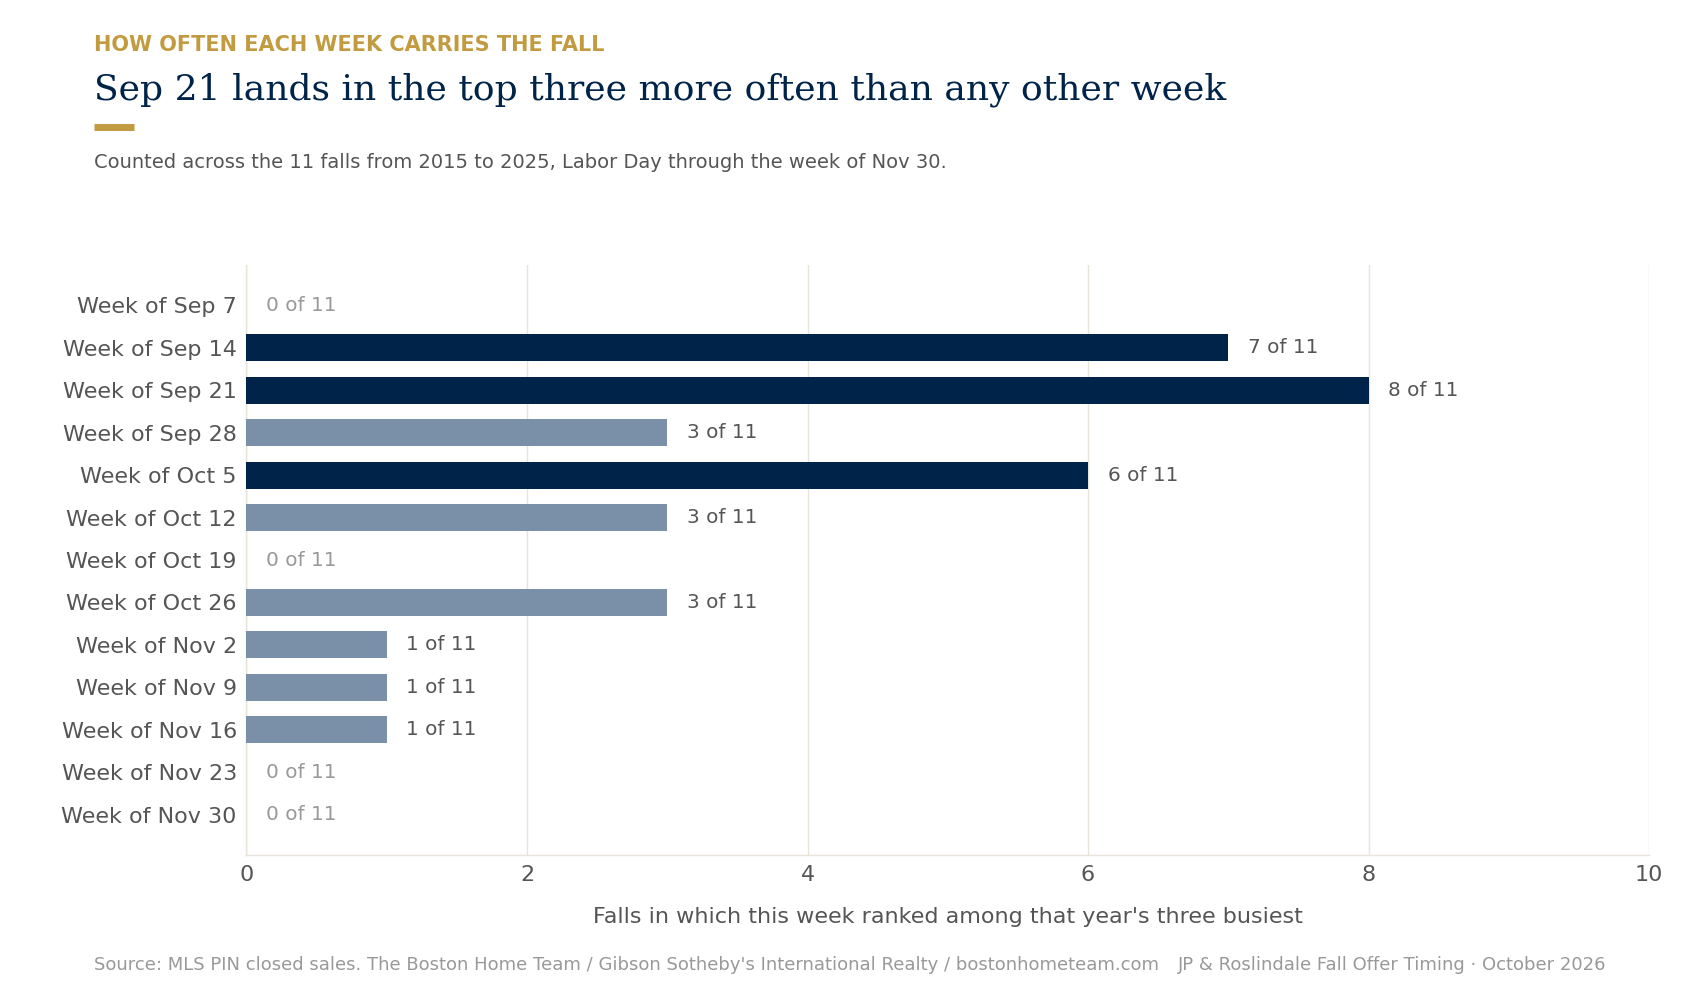
Falls in which each week ranked among that year’s three busiest, counted from Labor Day through the week of Nov 30, 2015 to 2025.
Four markets, four different calendars
The drop-off dates use a three-week rolling average so a single slow week does not trigger them. Single-family sales are fewer, about 2 to 3 a week at peak, so their dates are approximate.
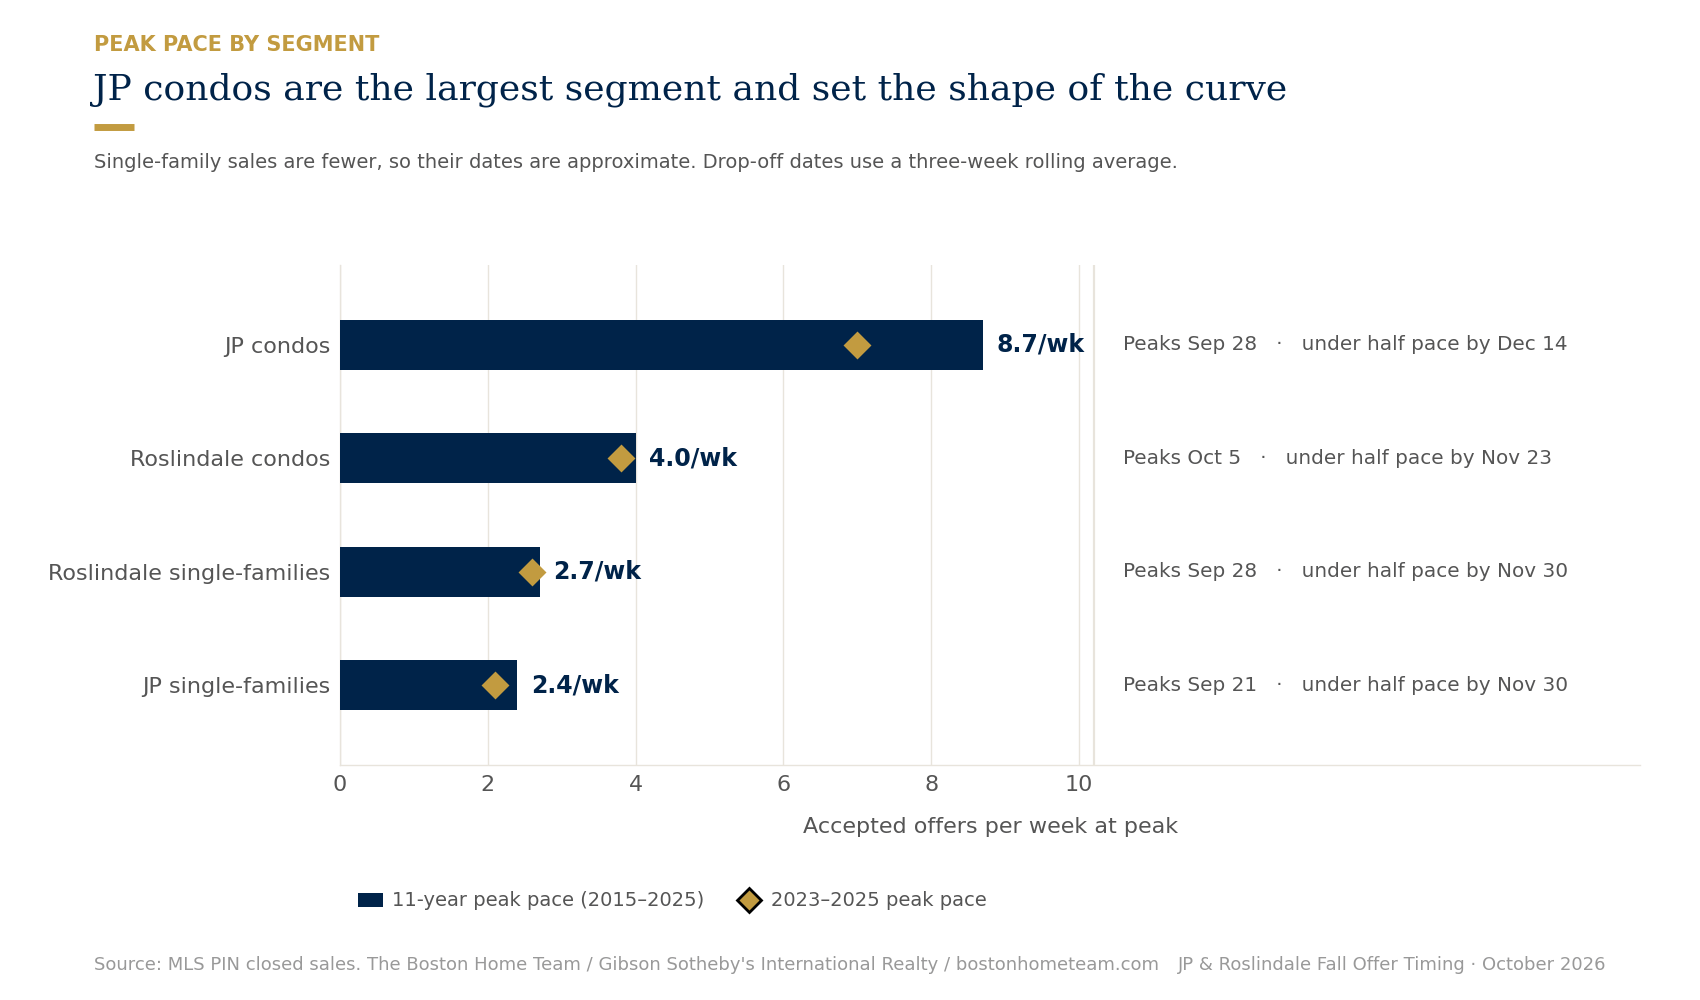
Accepted offers per week at peak, by segment. Gold diamonds mark the 2023–2025 peak pace for each segment.
Is this a good time to list your home?
Yes, with a shelf life. The volume is still here. The leverage is not.
The week of Oct 19 sits at 76 on the index, about 80% of the September pace, and the four weeks that follow hold close to it. What has changed since September is speed and pricing power. A listing that went under agreement this week took a median of 10 days to get there and sold at asking. The two weeks that produced median sales over asking were Sep 14 and Sep 21, at 101.0% and 101.5%, and they are behind us.
How much runway is left depends on what you own. These are the dates each segment historically falls below 75% of its own peak pace:
One thing to read carefully: every week in this report is an accepted-offer date, not a list date. At the peak, offers landed about 7 days after a listing came out. On the shelf it runs 10 to 18. Back your launch date out accordingly. It is also worth knowing that 44% of fall offers are accepted on a Monday or Tuesday, after weekend open houses and Monday offer deadlines.
When is the next best window for listing?
Spring. It is the only window in this data that beats the fall peak.
The average spring week, mid-April through mid-June, runs 19.1 accepted offers. The four fall peak weeks run about 17.2. The fall peak is roughly 90% of an average spring week, and the second shelf we are on now is about 80% of that fall peak.
If spring is not the plan, the next fall window opens the week after Labor Day. Sep 14 and Sep 21 are the only two weeks of the entire fall with median sales over asking, and they ranked among their year’s three busiest weeks in 7 and 8 of the last 11 falls. Oct 5 did it in 6. Labor Day week itself is the slowest week of the fall at 5.5 accepted offers, because new listings launch that week and the offers land the next.
Between here and spring, the calendar is documented plainly. Volume holds through Nov 16. Thanksgiving week cuts it to about 8.6 a week, half of peak. The last two weeks of December fall under 5 a week, and the offers that do come are on listings 3 to 8 weeks old.
Every week, Aug 3 through Dec 28
“Index” compares each week with the average of the four strongest weeks, where 100 equals that peak average. “Top 3” counts how many of the 11 falls had that week among their three busiest weeks from Labor Day through the week of Nov 30. Days to offer and sale-to-list are medians for the listings that went under agreement that week.
Week of | Avg offers | Index | 2023–25 | Top 3 | Days to offer | Sale-to-list |
|---|---|---|---|---|---|---|
Summer lull | ||||||
Aug 3 | 9.8 | 57 | 7.0 | — | 8 | 100.0% |
Aug 10 | 11.3 | 66 | 11.0 | — | 9 | 100.0% |
Aug 17 | 10.7 | 62 | 7.7 | — | 9 | 100.0% |
Aug 24 | 7.2 | 42 | 3.7 | — | 8 | 100.0% |
Aug 31 | 9.4 | 55 | 5.7 | — | 10.5 | 100.0% |
Sep 7 · Labor Day | 5.5 | 32 | 5.0 | 0 / 11 | 8.5 | 100.0% |
Peak | ||||||
Sep 14 | 17.4 | 102 | 14.3 | 7 / 11 | 7 | 101.0% |
Sep 21 | 17.4 | 101 | 11.7 | 8 / 11 | 7 | 101.5% |
Sep 28 | 16.4 | 96 | 13.3 | 3 / 11 | 10 | 100.2% |
Oct 5 | 17.4 | 102 | 13.0 | 6 / 11 | 9.5 | 100.0% |
Second shelf | ||||||
Oct 12 | 14.6 | 85 | 13.3 | 3 / 11 | 13 | 100.0% |
Oct 19 · this week | 13.0 | 76 | 8.0 | 0 / 11 | 10 | 100.0% |
Oct 26 | 15.1 | 88 | 13.7 | 3 / 11 | 16 | 99.5% |
Nov 2 | 13.1 | 76 | 11.3 | 1 / 11 | 17 | 100.0% |
Nov 9 | 13.1 | 76 | 11.3 | 1 / 11 | 13 | 100.0% |
Nov 16 | 13.8 | 80 | 9.0 | 1 / 11 | 18 | 99.3% |
Drop-off | ||||||
Nov 23 · Thanksgiving | 9.1 | 53 | 7.0 | 0 / 11 | 14.5 | 100.0% |
Nov 30 | 8.0 | 47 | 6.0 | 0 / 11 | 42.5 | 98.3% |
Dec 7 | 9.4 | 54 | 5.0 | — | 22 | 100.0% |
Dec 14 | 8.1 | 47 | 7.0 | — | 28 | 100.0% |
Dec 21 | 4.5 | 26 | 3.3 | — | 22.5 | 99.9% |
Dec 28 | 2.7 | 16 | 2.3 | — | 59 | 98.0% |
Thanksgiving lands in the Nov 23 or Nov 30 week depending on the year. 44% of fall offers are accepted on a Monday or Tuesday, after weekend open houses and Monday offer deadlines.
The September burst is weaker and the plateau stretches into late October, but the Thanksgiving drop still arrives on schedule.
This report covers Jamaica Plain and Roslindale using closed MLS PIN sales data from the fall seasons of 2015 through 2025, counted by the week each property went under agreement. Four segments are tracked separately: Jamaica Plain condos, Jamaica Plain single-family homes, Roslindale condos, and Roslindale single-family homes. Only completed sales are counted, so deals that went under agreement and later fell through are excluded and true activity ran slightly higher, though the timing pattern is the same. Weeks run Monday to Sunday and are lined up on Labor Day each year, then labeled with the matching 2026 dates. Drop-off dates by segment use a three-week rolling average. This report is part of an ongoing series tracking real estate conditions across Greater Boston coverage markets published each season by The Boston Home Team at Gibson Sotheby’s International Realty. BJ Ray has tracked Greater Boston real estate data across these markets for 21 years.
© 2024 Sotheby’s International Realty. All Rights Reserved. Sotheby’s International Realty® is a registered trademark and used with permission. This website is not the official website of Sotheby’s International Realty. Sotheby’s International Realty does not make any representation or warranty regarding any information, including without limitation its accuracy or completeness, contained on this website. Real estate agents affiliated with Sotheby’s International Realty, Inc. and some independently owned offices are independent contractor sales associates and are not employees of Sotheby’s International Realty. Equal Housing Opportunity.
If you are weighing a fall launch in JP or Roslindale against waiting for spring, we will run your segment and price band against these same weeks and tell you what the calendar is worth in your case.