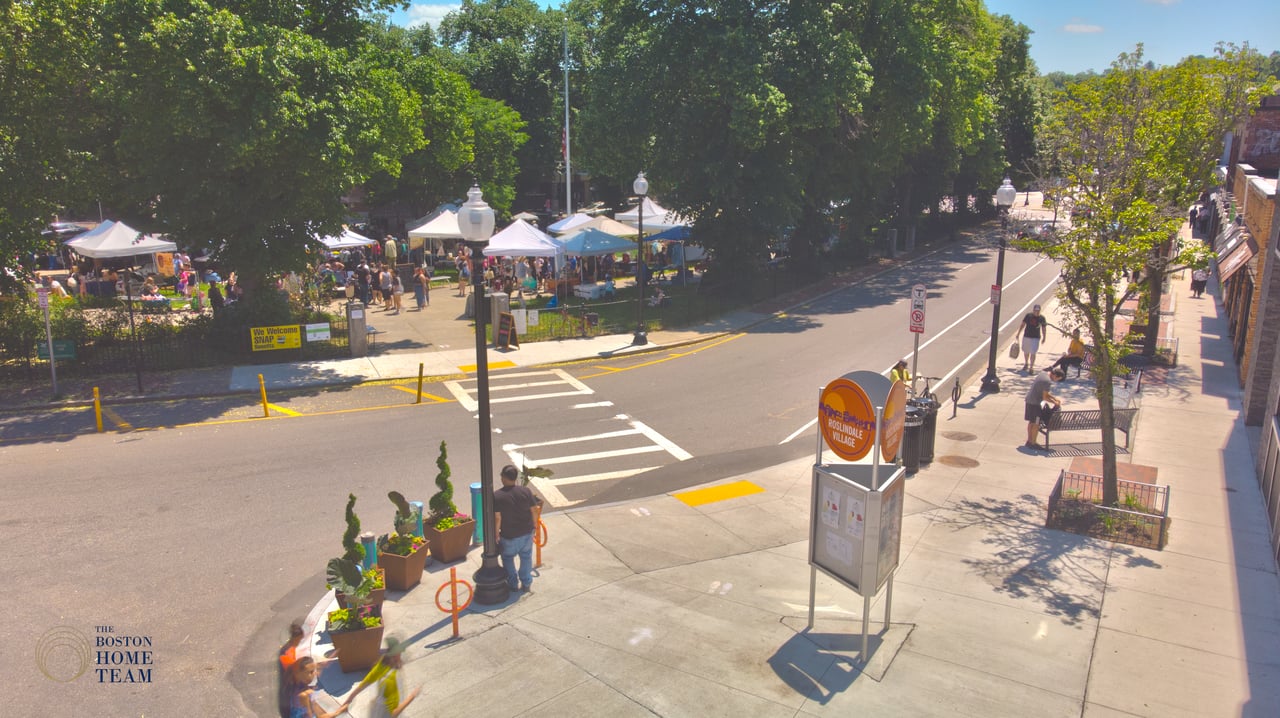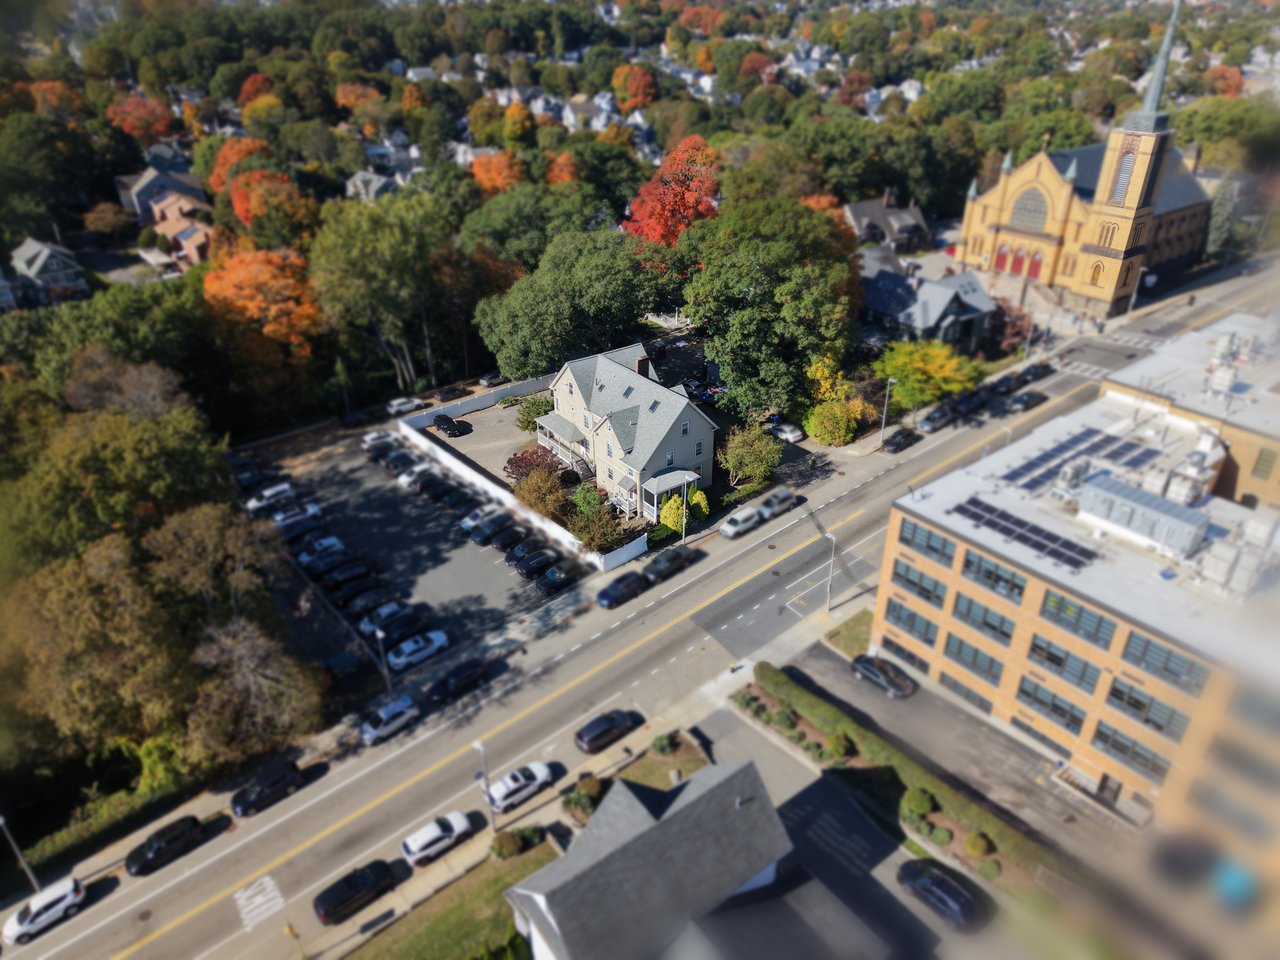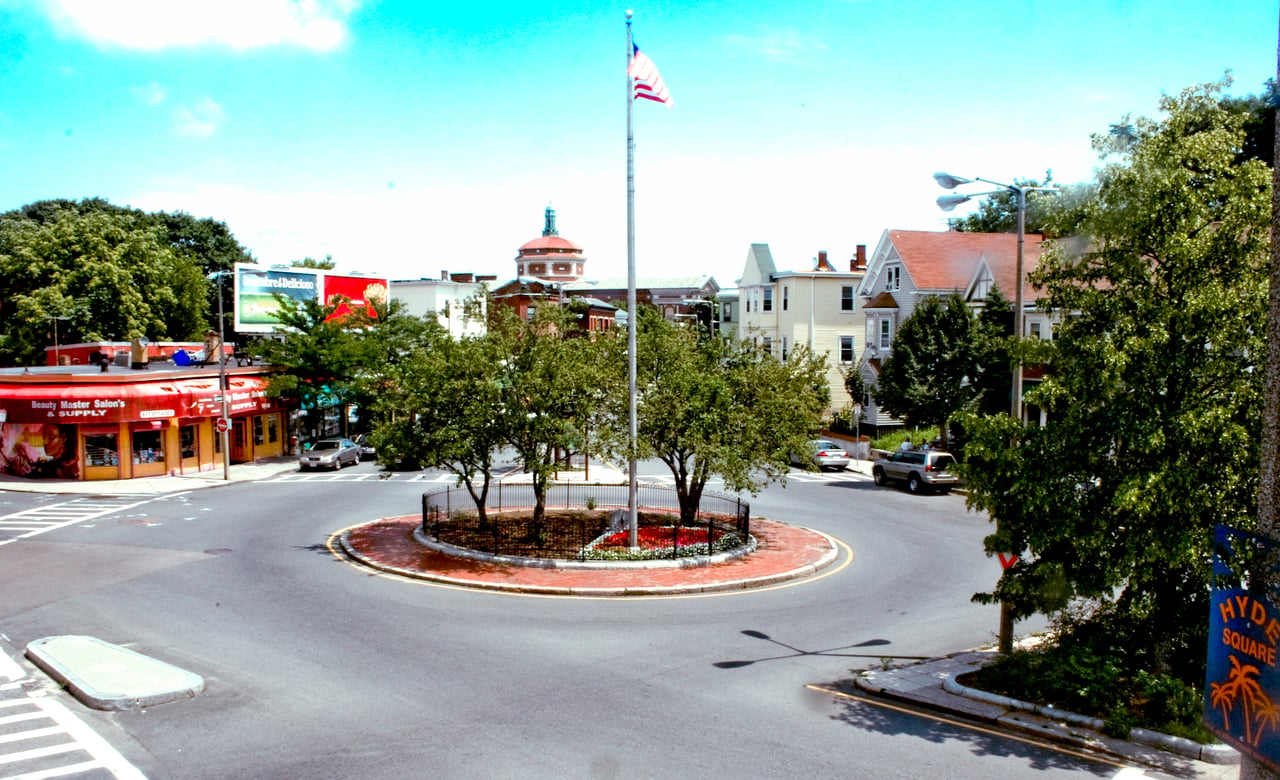
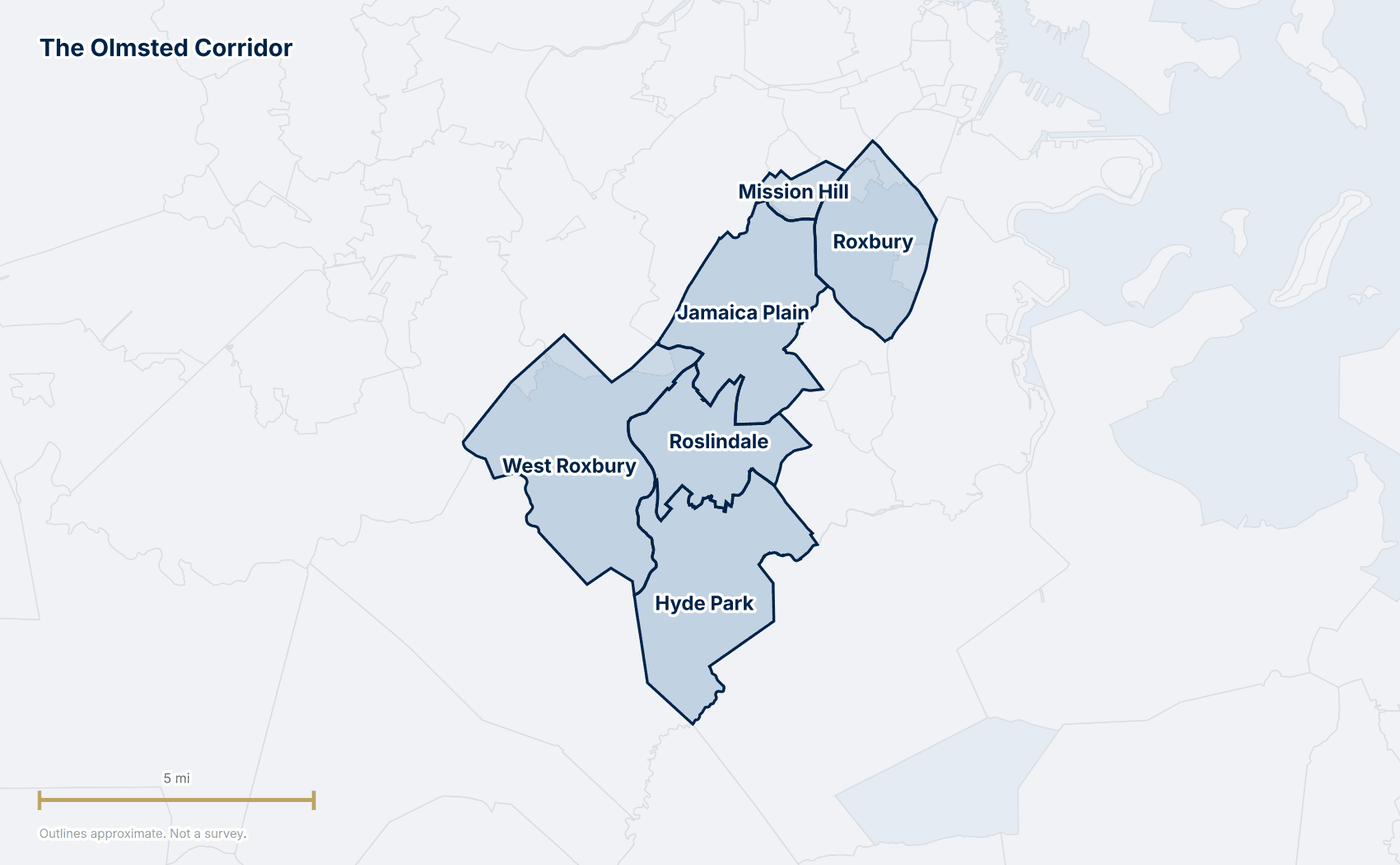
There is a green spine running southwest out of the city — the Fens, the Riverway, Olmsted Park, Jamaica Pond, the Arboretum, Franklin Park — and six neighborhoods strung along it. At the southern end the parkland stops being Olmsted's and becomes the Stony Brook Reservation and the Neponset, but the shape holds. It's a useful way to organize a market report. It is not a market.
So we're not going to give you a corridor-wide median price, because there isn't one worth printing. These six neighborhoods don't play the same schedule. Counts add up across a group; prices don't. What follows is each one on its own, and the differences between them this quarter are wider than any average across them would admit.
Between July and September these neighborhoods recorded 367 closings, 6.1% fewer than the same quarter a year ago. Volume came down. Almost nothing else did.
The Supply Gap Is the Story
Months of supply — how long it would take to clear everything on the market at the pace homes have been selling — runs from 2.3 months in West Roxbury to 8.1 in Roxbury. Those two neighborhoods share a name and about three miles of road, and on this measure they are not in the same league. Under three months is a seller's market. Over six is a buyer's. This corridor contains both, at the same time, in the same quarter.
The speed numbers say the same thing from the other direction. Five of these six neighborhoods got the typical home to an accepted offer inside 18 days and settled at or above asking price. Roxbury took 26 days and settled at 97.8%. Mission Hill, on a sample too small to lean on, took 23 days at 96.7%.
That is the shape of the quarter. Volume gave ground everywhere except Roslindale and Mission Hill. Speed and sale-to-list held almost everywhere. And one neighborhood sat apart from the rest on every measure that matters to a buyer deciding where to spend a Saturday.
The Scoreboard
Every neighborhood on the same measures. Days to offer and sale-to-list describe the busiest property type in each neighborhood, named in its own column — those are not blended across types, and neither are the medians anywhere in this report.
Neighborhood | Sold | vs. 2025 | Months | Busiest | Days to | Of Asking |
|---|---|---|---|---|---|---|
Jamaica Plain | 113 | −5.0% | 3.3 | Condo | 18 | 100.8% |
West Roxbury | 89 | −8.2% | 2.3 | Single family | 12 | 100.5% |
Roslindale | 72 | +9.1% | 2.9 | Condo | 11 | 101.3% |
Hyde Park | 46 | −23.3% | 2.9 | Single family | 9 | 100.6% |
Roxbury | 33 | −21.4% | 8.1 | Condo | 26 | 97.8% |
Mission Hill * | 14 | +100.0% | 2.4 | Condo | 23 | 96.7% |
* Mission Hill's condo figures rest on 6 sales, below the 10-sale floor this report uses. They describe those sales, not the wider market. Source: MLS PIN, closings July 1 – September 30, 2026. Months of supply per Gibson Sotheby's by-area inventory snapshot.
Fewer homes changed hands than a year ago, and the ones that did still cleared asking in under three weeks almost everywhere. This quarter didn't reprice. It thinned out.
Neighborhood by Neighborhood
Ordered by volume. Each neighborhood's price figures belong to its busiest property type that quarter — the one carrying the most transactions, and therefore the one whose median means something.
Jamaica Plain
Jamaica Plain closed 113 sales, more than any other neighborhood here, and the condo market carried 78 of them. The median condo came in at $700,000, down 5.2% on the year. Half of those sales had an accepted offer within 18 days and settled at an average 100.8% of asking — above list, in other words, even with the median down. On the supply side, 177 condo listings were on the market at some point in the quarter, 56 accepted an offer, and 42 were still waiting to close when the quarter ended.
Price down, speed intact, sale-to-list above 100%. That combination usually says the mix of what sold shifted rather than the market repricing. The 3.3-month supply figure puts JP in genuinely balanced territory — the only neighborhood here that lands between the two extremes.
West Roxbury
West Roxbury closed 89 sales, 54 of them single-family — the most house-driven market in the corridor. The median single-family sold for $866,000, down 2.7% on the year, with half of those sales under agreement inside 12 days at 100.5% of asking. Supply is the headline: 78 single-family listings came to market across the quarter, 36 accepted an offer, and 23 were still pending at quarter's end.
At 2.3 months, this is the tightest market we track in the corridor and one of the tighter ones anywhere in the city. A 2.7% dip in the median against twelve-day offers and above-ask settlements is not a market under pressure. It's a market with nothing to buy.
Roslindale
Roslindale is the only neighborhood in this report that sold more homes than it did a year ago — 72 closings, up 9.1% — and it did so at the highest sale-to-list ratio in the corridor. The condo market led with 38 sales at a median of $610,000, down 1.5% on the year, with half under agreement inside 11 days at 101.3% of asking. 71 condo listings came to market, 16 accepted an offer, and 12 were pending at quarter's end.
A 1.5% dip in the median alongside more sales and the fastest condo offers in the corridor is a volume story, not a price story. Roslindale was the gainer in our summer metro report and it has held that position through a quarter in which most of its neighbors gave ground.
Hyde Park
Hyde Park produced the fastest offers in the corridor and the sharpest volume drop. 46 sales closed, down 23.3% on the year, led by 29 single-family transactions at a median of $640,000 — down 9.6%, the largest price move in this report. Half of those sales had an accepted offer within nine days at 100.6% of asking. 55 single-family listings came to market, 25 accepted an offer, and 19 were still pending when the quarter closed.
Read those two numbers together before reading either alone. A 9.6% drop in the median next to nine-day offers and above-ask settlements is very hard to explain as falling values. Far more likely: with a quarter of the usual volume missing, what sold was a smaller and less expensive set of houses than last summer's. We'd want price-per-square-foot on both years before calling this anything other than a composition shift — and that figure isn't in this quarter's export. Treat the −9.6% as provisional.
Roxbury
Roxbury is the exception on every measure in this report, and it's the one most worth understanding. 33 sales closed, down 21.4%. The condo market led with 16 at a median of $662,500 — up 6.9%, the only price gain in the corridor. Half took 26 days to an accepted offer, the longest here, and settled at 97.8% of asking, the only figure below list. On the supply side the gap is stark: 108 condo listings came to market in the quarter and 15 of them accepted an offer.
Price up, speed down, inventory stacked six deep behind every closing. That is what a market with real selection looks like — sellers who price correctly are getting their number, and the rest are waiting. For a buyer who has spent this year losing to twelve-day offers in West Roxbury, this is the one address in the corridor where patience is still an asset. The 16-sale condo sample clears our reporting floor but sits close to it; read the direction, not the decimal.
Mission Hill
Mission Hill is the smallest market here and the figures should be read accordingly. 14 sales closed, double last year's seven — a doubling off a base that small describes those fourteen transactions, not a trend. The condo market led with six at a median of $590,000, below the 10-sale floor this report uses, so we're not printing a year-over-year price change for it. Those six took a median 23 days to an accepted offer and settled at 96.7% of asking. 11 condo listings came to market, 3 accepted an offer, 2 were pending at quarter's end.
What's reportable: supply here is tight at 2.4 months, and the neighborhood sold twice as many homes as it did last summer. What isn't: anything about where prices are going. Come back in a quarter or two.
Three Years of Prices
Q4 2023 through Q3 2026. Every line is one property type in one neighborhood, so the gap between what a house costs and what a condo costs in the same place can be read directly. Third quarters are the summer peak in most years, which is why the comparison that means anything is a quarter against the same quarter a year earlier — not against the one before it.
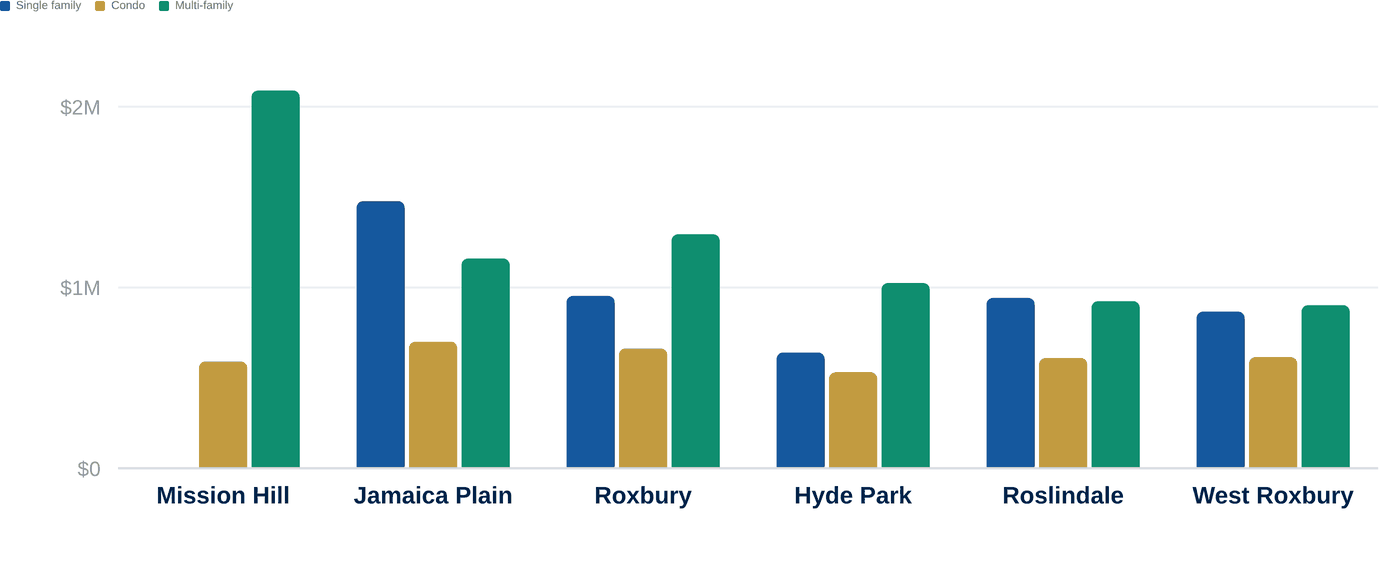
Each panel is one neighborhood, each line one property type. Every panel shares the one scale marked down the left, so the panels compare with each other as well as within themselves. A quarter in which a type sold fewer than three homes has no median to show — one or two sales is those houses' prices, not the neighborhood's — so the line is dotted across it rather than guessing. A type that clears that floor in fewer than half the quarters is left out of its panel.
How the Neighborhoods Compare
The same quarter, every neighborhood, split by property type. Two things jump out. Jamaica Plain's single-family median sits well clear of everything else in the corridor. And in four of the six, the multi-family bar clears the single-family bar — three-family houses here are priced as income, not as homes, and that is why a neighborhood's “median price” depends entirely on which type happened to trade.
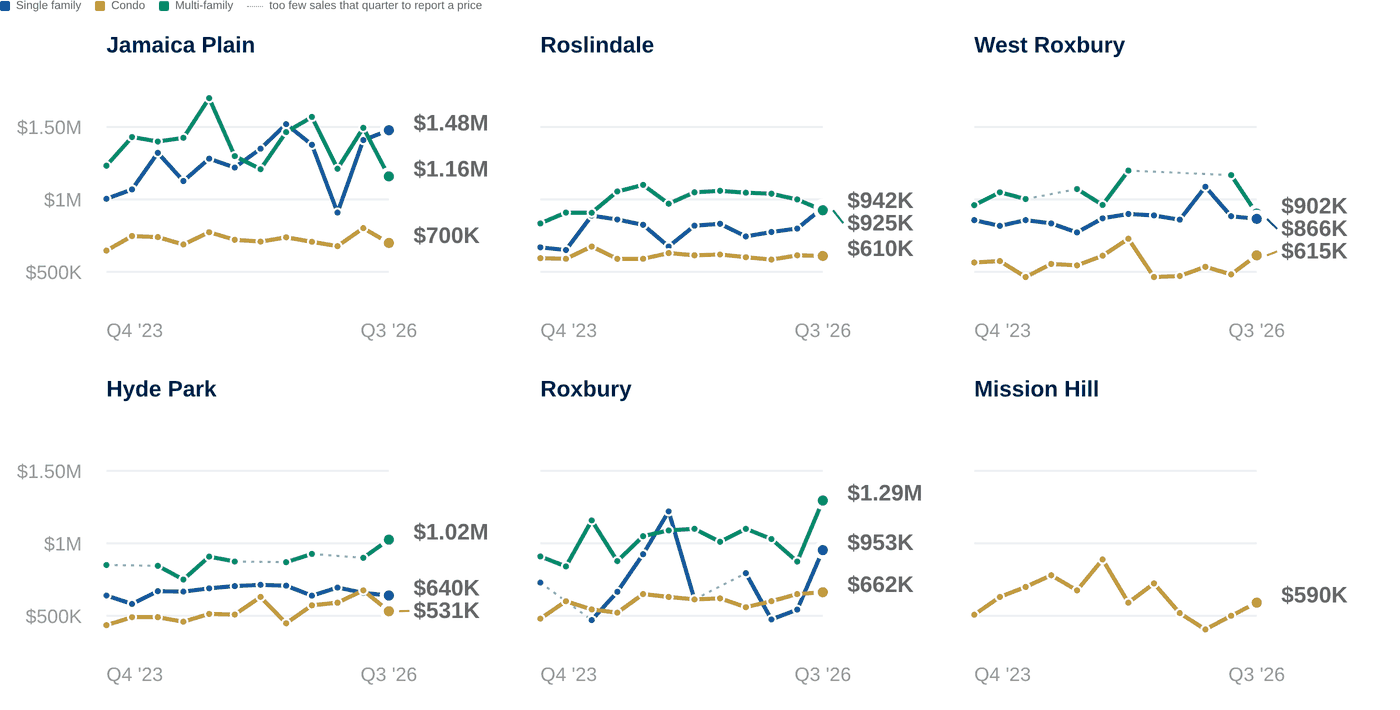
Each bar is that neighborhood's own median for that type. A type with fewer than three sales in a neighborhood is left blank rather than estimated.
What It Costs to Rent Here
For anyone weighing a purchase against staying put, and for owners running the numbers on a unit, here is the rental picture across the same six neighborhoods by bedroom count. The ordering is not the ordering of sale prices, which is the useful part — Mission Hill carries the highest rents in the corridor at every bedroom count and the lowest reportable condo median.
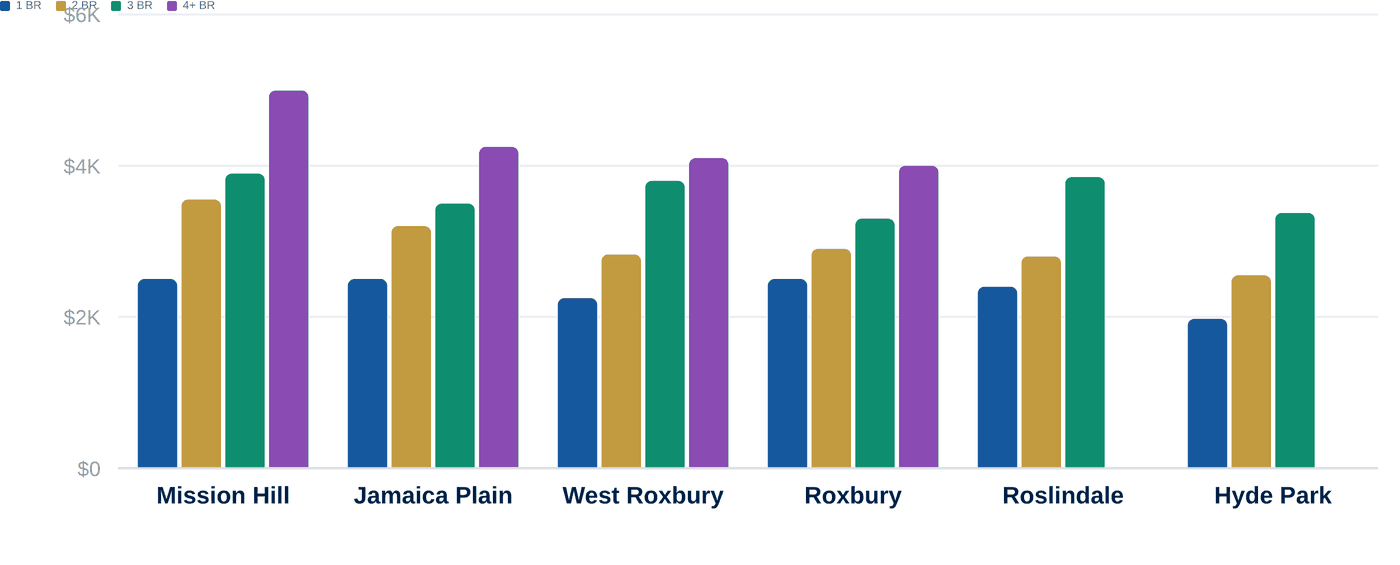
Each bar is that neighborhood's own median lease. A bedroom count with fewer than five leases is left blank. Rental market time and days to accepted application are measured differently from anything on the sales side of this report and are covered separately in our fall rental report.
What the Fourth Quarter Usually Does to Prices
Across the 225 neighborhood-and-type combinations in this report's wider region with enough history to measure, the fourth quarter's median sale price has come in below the third quarter's in about 70% of them, typically by around 1.8%. That pattern is mostly about mix rather than about values. Summer is when the largest and best-prepared houses come to market; what trades in November and December is a smaller, different set of homes. A median that slips in the autumn is usually describing those homes, not a market that repriced.
Within these six neighborhoods, nine combinations carry enough history to say anything, and seven of them have usually seen the fourth quarter come in lower. The clearest are Roslindale single-family at about 4.6% below, Jamaica Plain single-family at about 3.9% and West Roxbury single-family at about 3.4%, each measured over eleven years. Roslindale condos and Roxbury multi-family have historically finished the year about where the summer left them.
195 homes across these neighborhoods had an accepted offer but had not closed when the quarter ended, and most of those settle in the fourth quarter. If this autumn follows the usual shape, the Q4 medians would read a little below the ones above, with single-family moving most and condos moving least. That is a pattern drawn from past years, not a forecast, and the range around it is wide — the same history includes autumns that finished well above the summer. Nothing here is advice to buy or sell.
What This Means for You
If you're buying and you've been losing: look at where you're losing. Twelve-day offers in West Roxbury and nine-day offers in Hyde Park are a different game from a 26-day market in Roxbury with 108 condo listings behind it. Same corridor, same commute, entirely different negotiating position. Widening the search by one neighborhood may do more for you this autumn than widening it by $100,000.
If you're selling a single-family in West Roxbury, Roslindale or Hyde Park: the data says price it to the market and it moves inside two weeks at or above ask. It also says the fourth quarter has historically taken 3–5% off single-family medians in exactly these neighborhoods. Those two facts aren't in conflict — the seasonal effect is about which houses list, not about what yours is worth — but if the choice is October versus March, that's a real conversation and worth having with your own numbers in front of you.
If you own a multi-family anywhere in the corridor: the four largest sales in this report were all multi-unit buildings, and three of the four closed below ask. Income property here is being underwritten on the math, not bid up on scarcity. Price to the rent roll and you'll find a buyer; price to a neighbor's single-family comp and you'll sit.
If you're watching Roxbury: this is the one market in the corridor where supply gives a buyer actual leverage, and where a seller has to earn the number. If you're on either side of that, the specifics of your building matter more than the neighborhood average — and we're happy to walk through them.
The Numbers Are One Thing. The Experience Is Another.
BJ presented a thorough analysis of the market, gave expert advice on physical improvements to make, and marketed the listing successfully. The house sold within one week at a price 10% higher than we thought we would receive — all during a recession.
After interviewing other JP realtors, I chose BJ because of his depth of understanding of the market and sophisticated reasoning around timing, pricing, and bidding. The listing process was smooth. BJ was right on with his pricing — I accepted a final offer a few percentage points above listing price.
From staging advice to marketing materials to working through the selling process, every step exceeded expectations. It was impressive how quickly and efficiently this group handled everything — we are truly grateful.
Meredith was our agent and she took care of everything — staging, open houses, showings — all while I was living abroad. She found us a buyer within 2 weeks of listing at our desired price. The Boston Home Team created all the marketing and was thorough in collecting every detail a buyer would want to know.
How to Read These Numbers
Medians, not averages. A single high sale moves an average and leaves a median alone. Sale-to-list percentages are averages, and are labeled as such.
Sample floors. A change against last year prints only where there were 10 or more sales on both sides of the comparison. Below that, figures describe the sales themselves and say so. Below five, we report the count and nothing else.
Every median belongs to one neighborhood and one property type. Counts add across a group. Prices do not. There is no corridor-wide median in this report because there is no corridor-wide market.
Days to offer, not days on market. Days to offer measures completed sales from list to accepted offer. Days on market measures what is still sitting unsold, which biases toward whatever hasn't moved. They are different numbers and we don't mix them.
Months of supply is how long it would take to sell everything currently on the market at the rate homes have sold over the past year. Under three favors sellers, three to six is balanced, six and over favors buyers. We use Gibson Sotheby's own by-area inventory figure so these calls match the firm's weekly snapshot.
Source: MLS PIN closed-sale data covering July 1 – September 30, 2026 for Hyde Park, Jamaica Plain, Mission Hill, Roslindale, Roxbury and West Roxbury, with 12-quarter history from Q4 2023. Months of supply per Gibson Sotheby's International Realty by-area inventory snapshot. Rental figures are from closed leases over the same period and are measured separately from sales. Days to offer describes completed sales; it is not the same measure as days on market for active listings.
The Boston Home Team · Gibson Sotheby's International Realty · 673 Centre Street, Jamaica Plain, MA 02130 · 617.249.4237 · bostonhometeam.com
© 2026 Sotheby's International Realty. All Rights Reserved. Sotheby's International Realty® is a registered trademark and used with permission. Each Sotheby's International Realty office is independently owned and operated, except those operated by Sotheby's International Realty, Inc. This material is based upon information which we consider reliable but because it has been supplied by third parties, we cannot represent that it is accurate or complete and it should not be relied upon as such. All offerings are subject to errors, omissions, changes including price or withdrawal without notice. If your property is listed with a real estate broker, please disregard. It is not our intention to solicit the offerings of other real estate brokers. We are happy to work with them and cooperate fully. Equal Housing Opportunity.