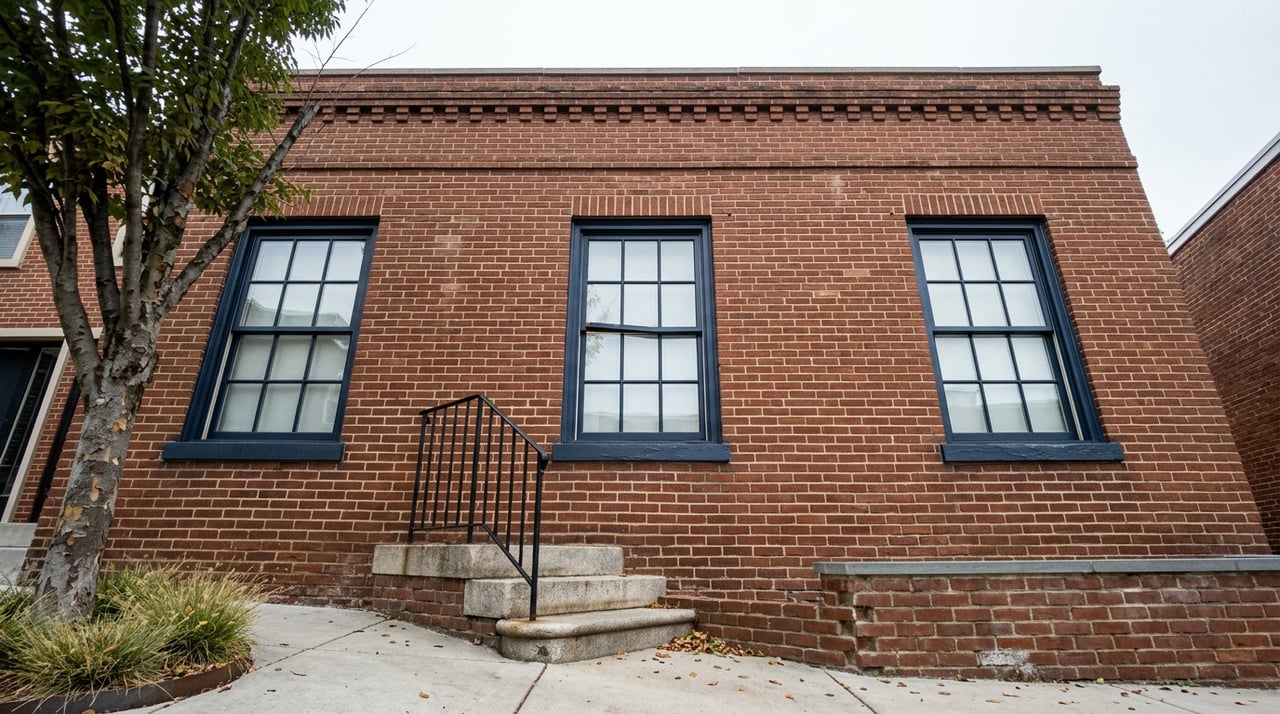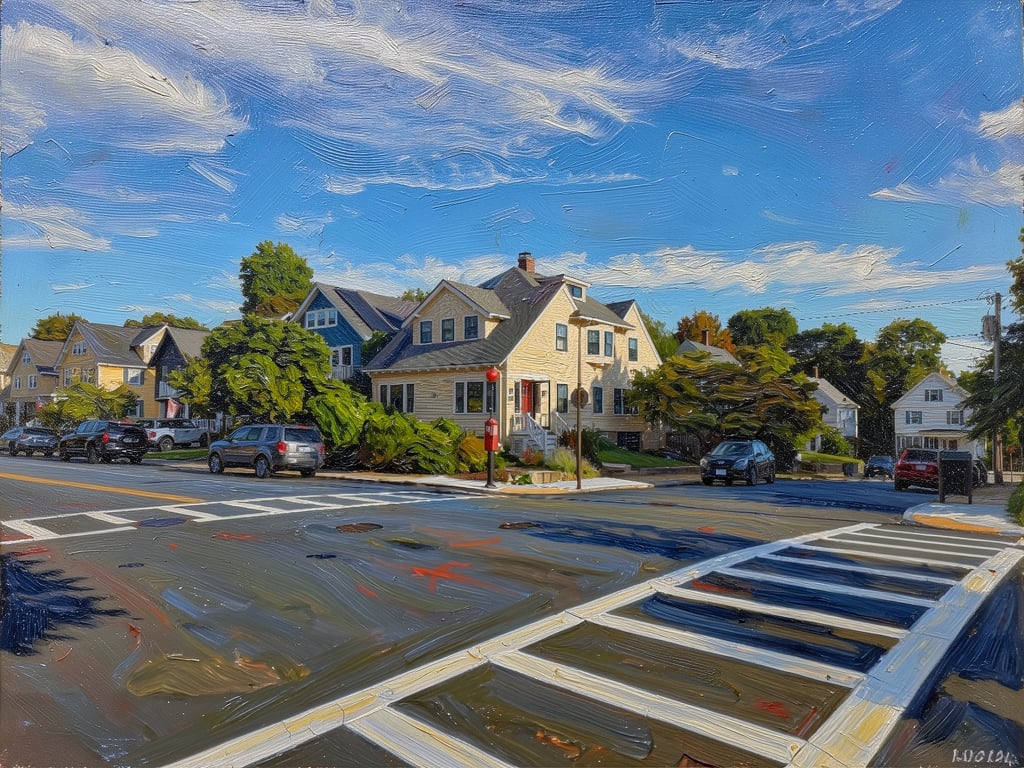
Jamaica Plain, Roslindale and West Roxbury run into each other along the southwest edge of the city. Cross Washington Street or the far end of the Arboretum and you have changed neighborhoods without changing much else — same housing stock, same commute, often the same buyers touring all three on a Saturday.
So it would be reasonable to expect three similar market readings. That is not what the data shows. The three neighborhoods look far more alike than they look different — but inside each one, single-family and condo are running two separate markets.
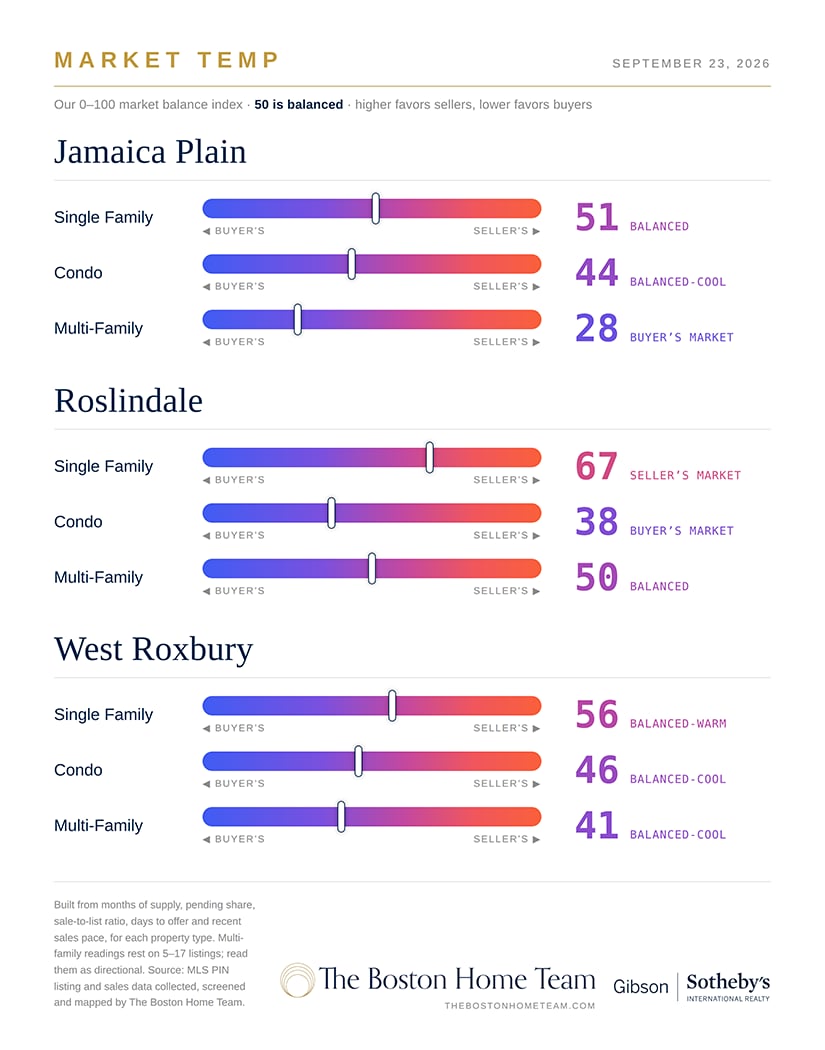
Market Temp readings for Jamaica Plain, Roslindale and West Roxbury, as of September 23, 2026.
What the Number Means
Market Temp is our 0–100 balance index. Fifty is balanced. Higher favors sellers, lower favors buyers.
It combines six things we track for every area and every property type: months of supply, the share of listings already under agreement, the sale-to-list ratio over the trailing year, how long a typical listing takes to accept an offer, the recent pace of closings, and the count of homes actively for sale. The scale is calibrated against the Greater Boston distribution rather than the national six-months-of-inventory convention, which was built for a very different market than this one.
One thing it deliberately does not do is forecast. It describes the conditions a buyer or seller is walking into this week.
The Nine Readings
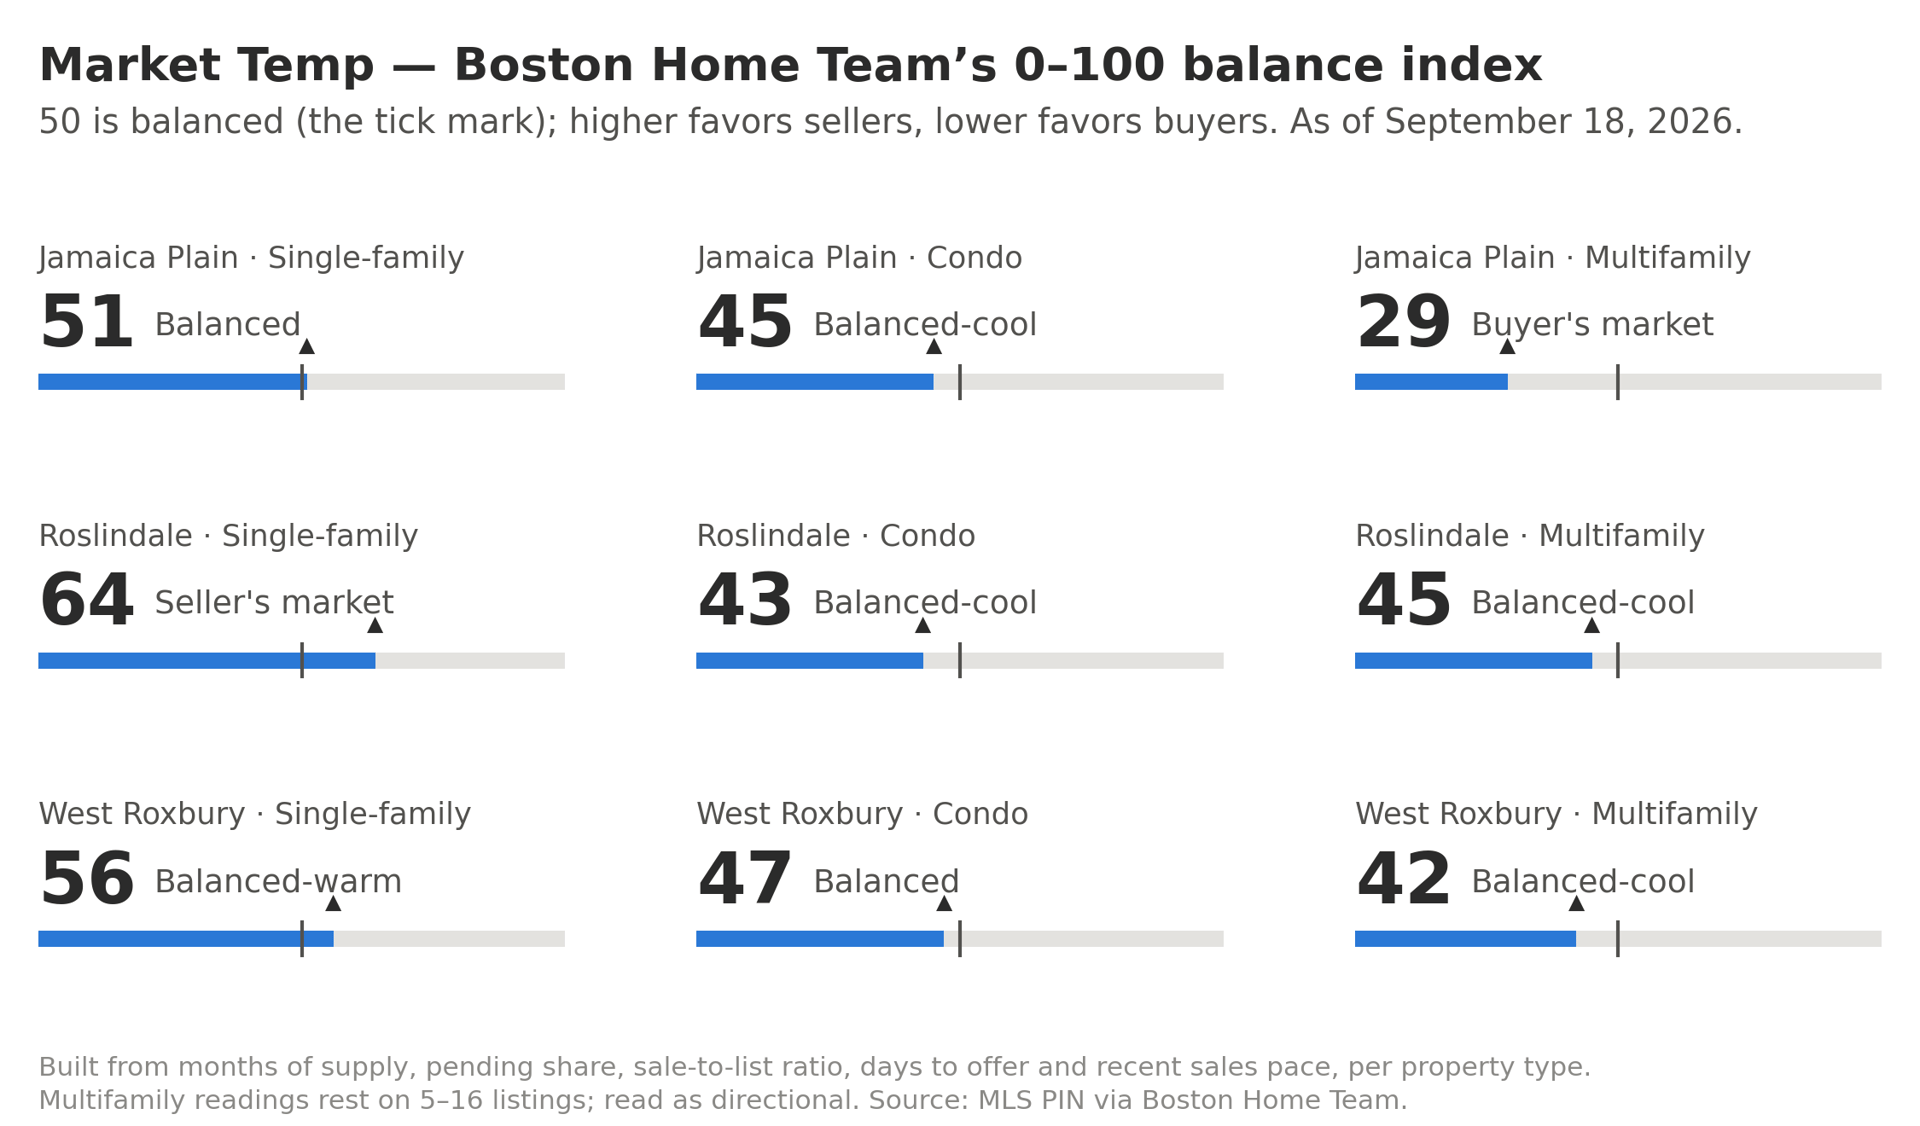
Three neighborhoods, three property types, one index. Read down the columns rather than across the rows.
Neighborhood | Single-Family | Condo | Multifamily |
|---|---|---|---|
Jamaica Plain | 51 | 44 | 28 |
Roslindale | 67 | 38 | 50 |
West Roxbury | 56 | 46 | 41 |
Every single-family reading sits at or above balanced. Every condo reading sits below it.
Source: MLS PIN listing and sales data, collected and mapped by The Boston Home Team. Current as of September 23, 2026.
A seller in Roslindale and a seller in Jamaica Plain have more in common with each other than either has with the condo owner on the next block.
Single-Family Is the Tight End of All Three Markets
Roslindale is the tightest of the nine at 67. Eleven single-family homes were listed for sale, against 1.7 months of supply — the lowest figure on the board. Thirty-nine percent of those listings were already under agreement, the typical one took seven and a half days to accept an offer, and over the trailing twelve months single-family sales there closed at 103.8 percent of list price.
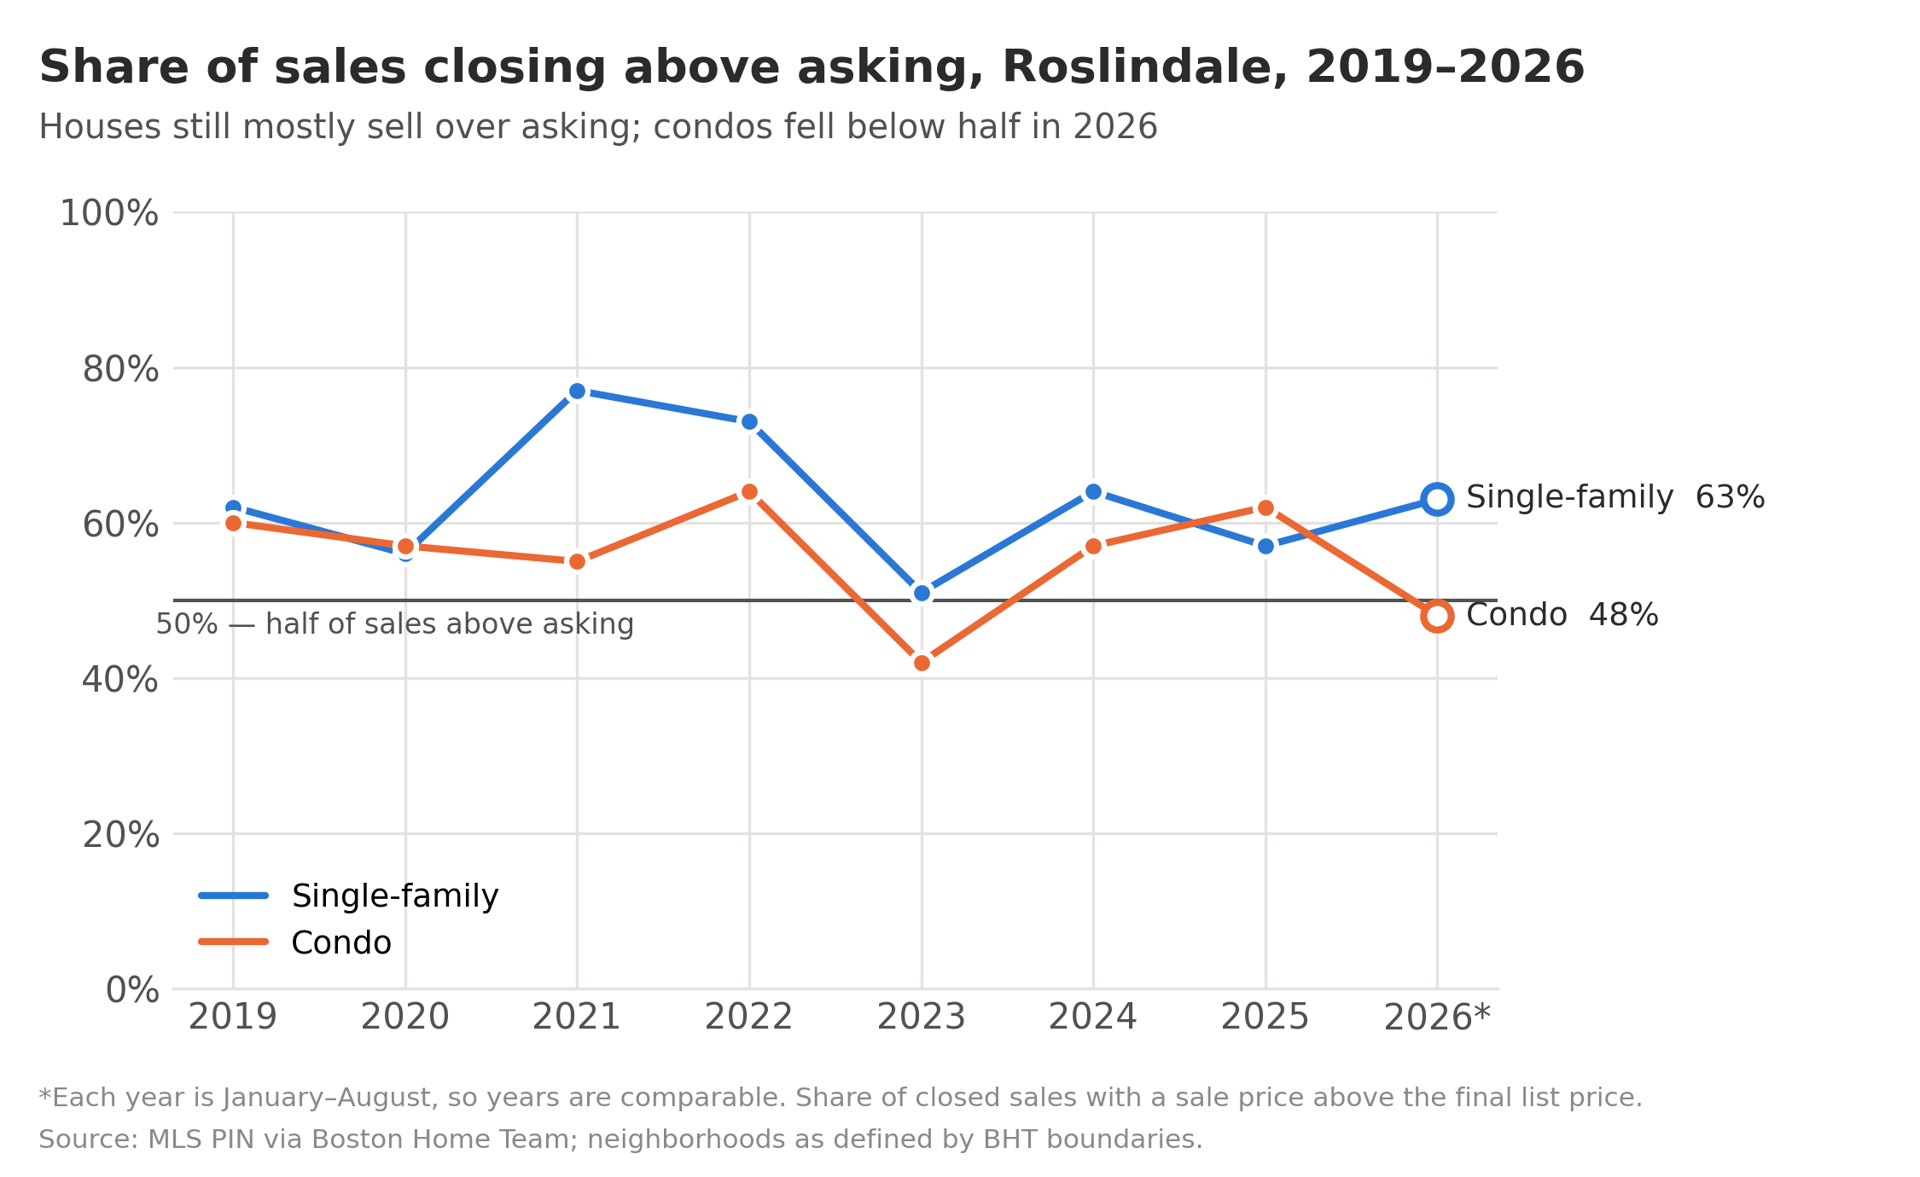
Roslindale houses still mostly sell over asking. Condos there fell below half in 2026. Each year covers January through August, so the years are comparable.
West Roxbury reads 56 with a deeper bench: 33 homes listed, 2.2 months of supply, 31 percent under agreement, a median of 11 days to an accepted offer, and 101.8 percent of list across the year.
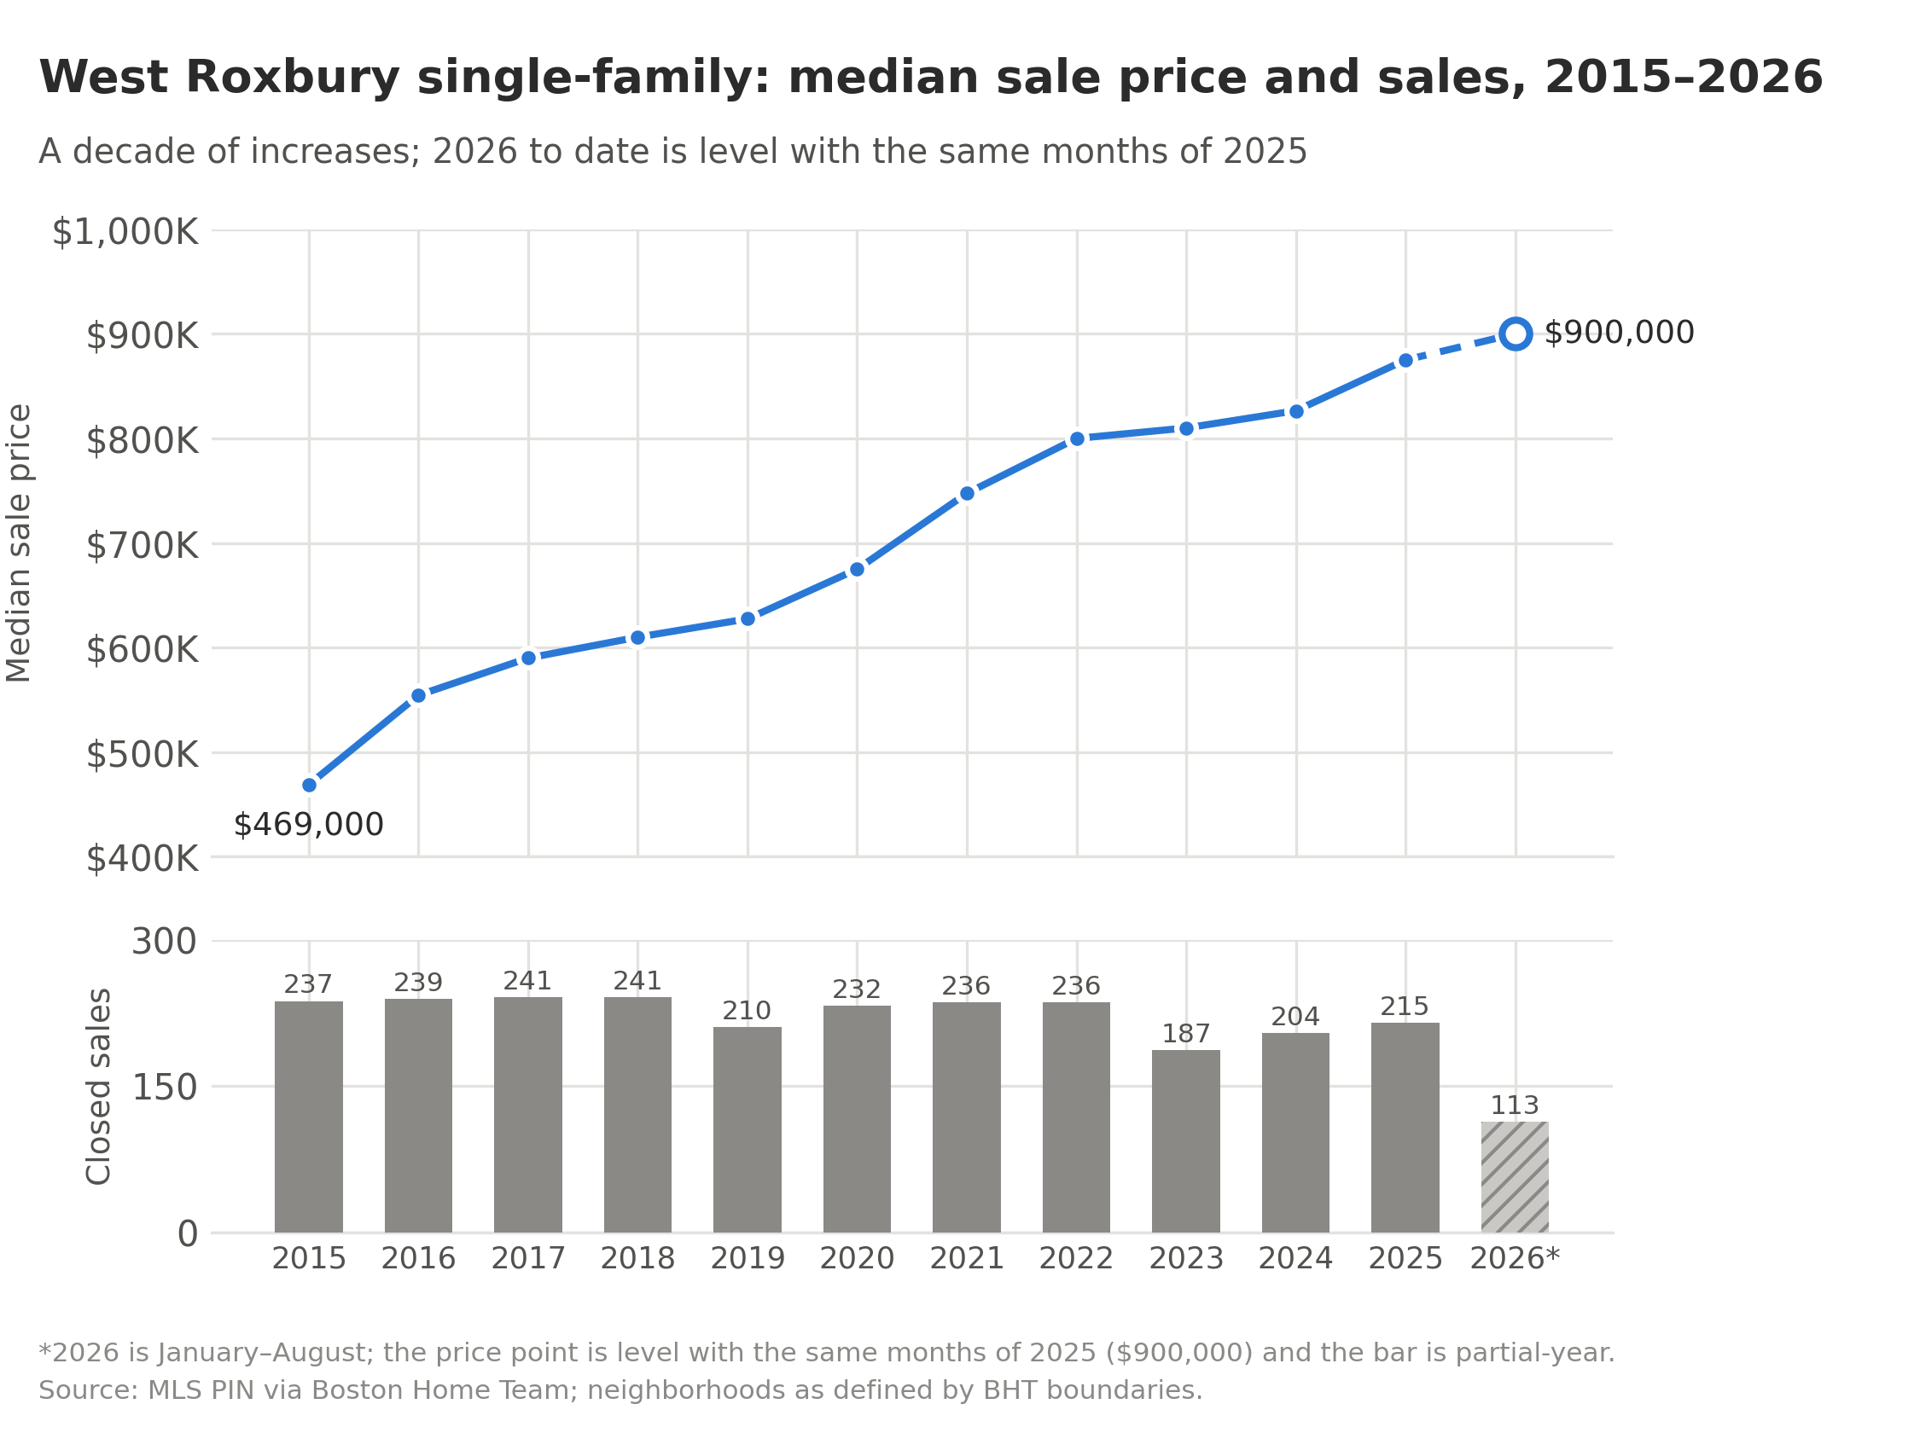
A decade of increases in West Roxbury, and a 2026 that is running level with the same months of 2025 at a $900,000 median.
Jamaica Plain reads 51, the most balanced of the three. Fifteen homes listed, 2.6 months of supply, 25 percent under agreement, 18 days to an offer, and 101.2 percent of list.
The common thread is worth stating plainly. In all three neighborhoods, single-family homes have been closing above their asking price on average, and in none of them does supply reach three months.
Condos Carry the Choice
The condo readings run 46 in West Roxbury, 44 in Jamaica Plain and 38 in Roslindale.
Roslindale holds the sharpest contrast on the board, and it is the reason to look at property type before geography. In the same neighborhood, in the same week, there were 37 condos listed against 11 single-family homes. Condos showed 3.8 months of supply against 1.7. Sixteen percent of condo listings were under agreement against 39 percent of single-family listings. Buyers looking at condos there have roughly three times the selection and considerably less competition than buyers looking at houses a few streets away.
Jamaica Plain carries the largest inventory of any cell on the board: 70 condos actively listed, 3.1 months of supply, 22.5 days to a typical accepted offer, and 100.7 percent of list over the year. That is a market where a well-prepared buyer has room to consider options, and where a seller benefits from being priced against a genuinely long shelf.
West Roxbury sits between them at 2.7 months and 20 days, with condos closing at 99.1 percent of list across the year — slightly under asking, on average.
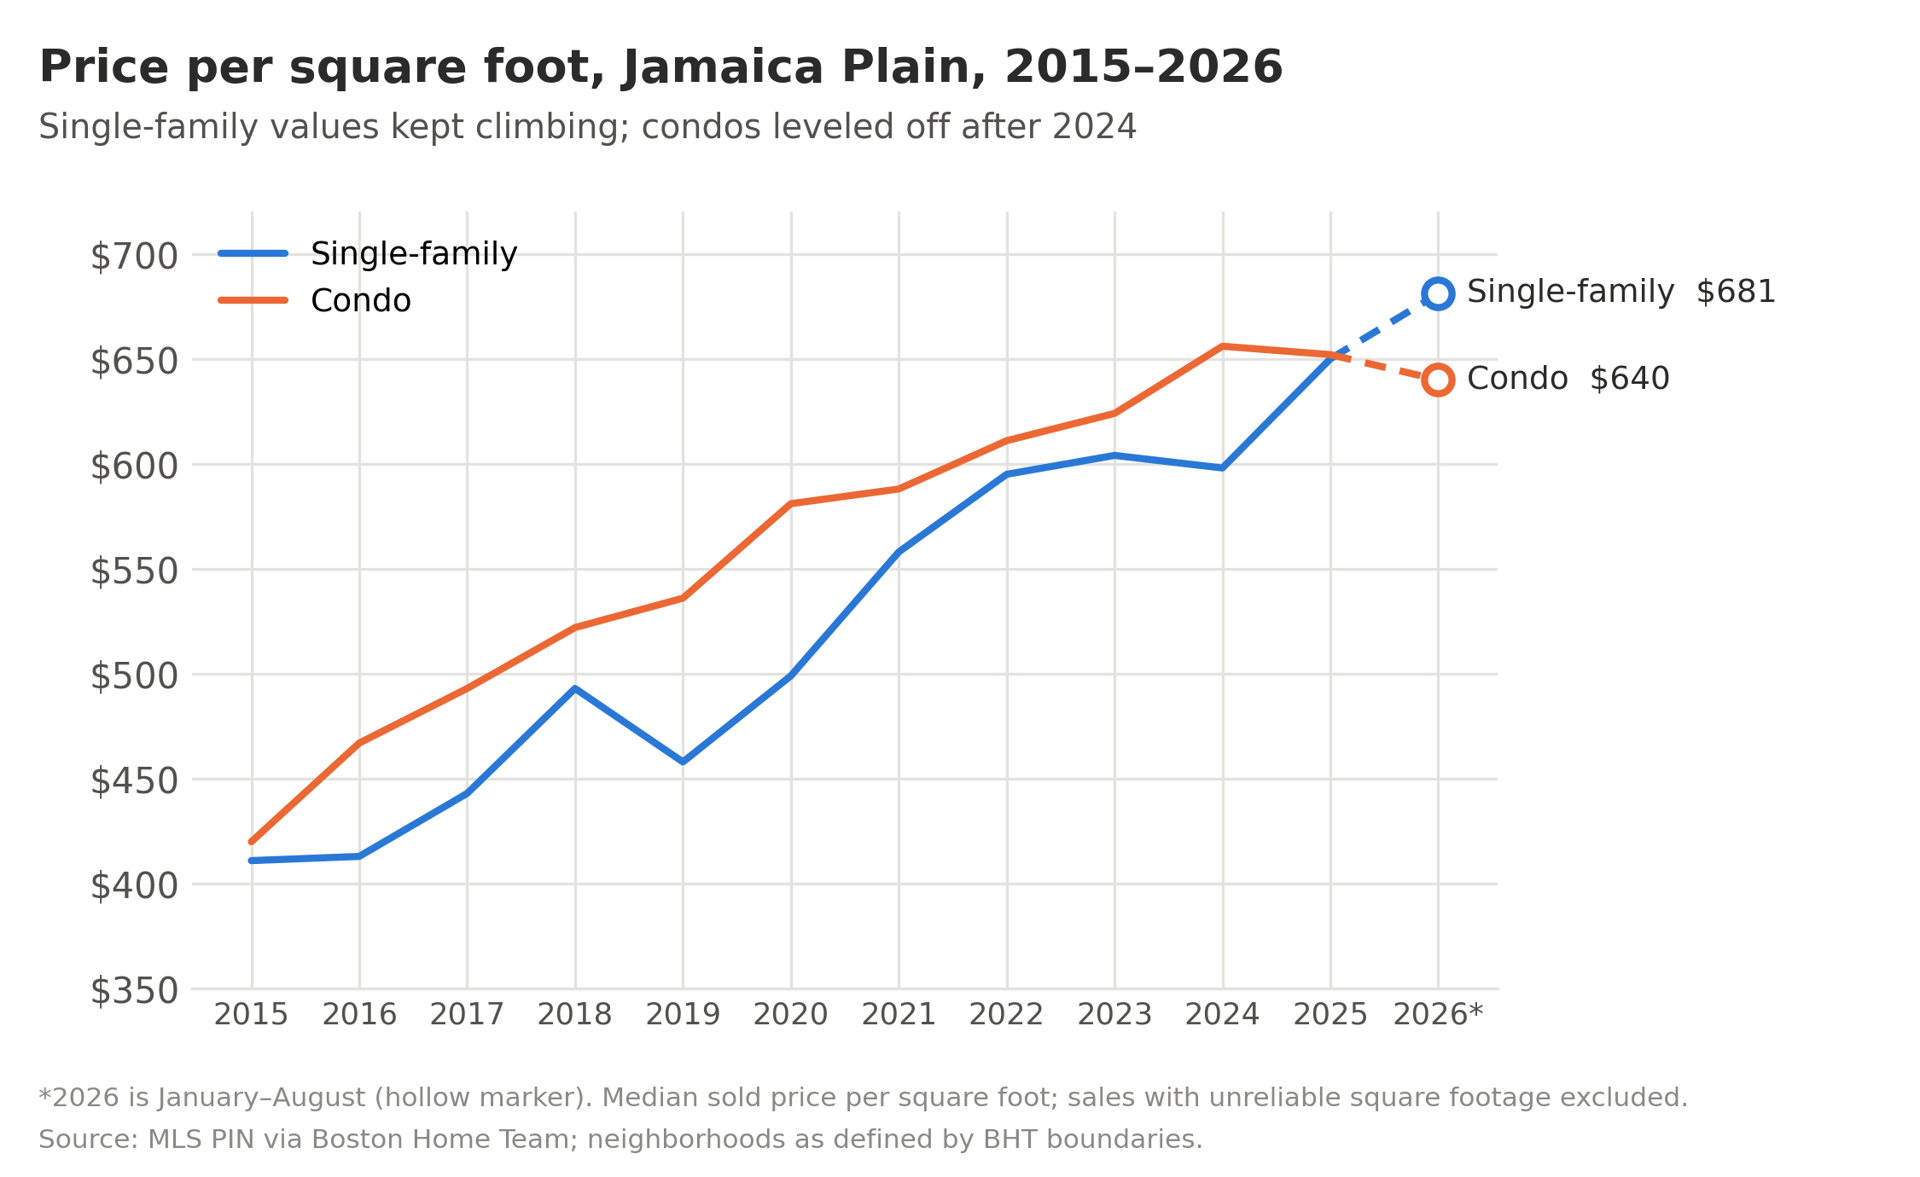
Jamaica Plain condos out-earned houses on a per-square-foot basis for most of the last decade. The two lines crossed in 2025, and in 2026 to date single-family sits at $681 against $640 for condos.
Multifamily Is Thin, and It Reads That Way
Jamaica Plain reads 28, West Roxbury 41, Roslindale 50, and all three rest on somewhere between five and seventeen active listings.
Jamaica Plain showed 17 multifamily listings against 5.1 months of supply, the longest on the board, with sales closing at 98.1 percent of list over the trailing year. West Roxbury had five listings and a 96.9 percent sale-to-list figure. Roslindale ran warmer, with nine listings, 3.2 months of supply and 102.3 percent of list.
None of the three had enough multifamily closings in the last ninety days to publish a median days-to-offer, so that figure is blank rather than estimated. These readings are directional, and we would rather say so than dress up a number that rests on a handful of transactions.
Where September Sits in the Year
Market Temp is a this-week reading, which makes it worth knowing what week it is. Closings in all three neighborhoods follow the same annual shape, and they have followed it two years running: a winter trough in February, a climb through spring, a peak in June and July, and a drop off that peak in August.
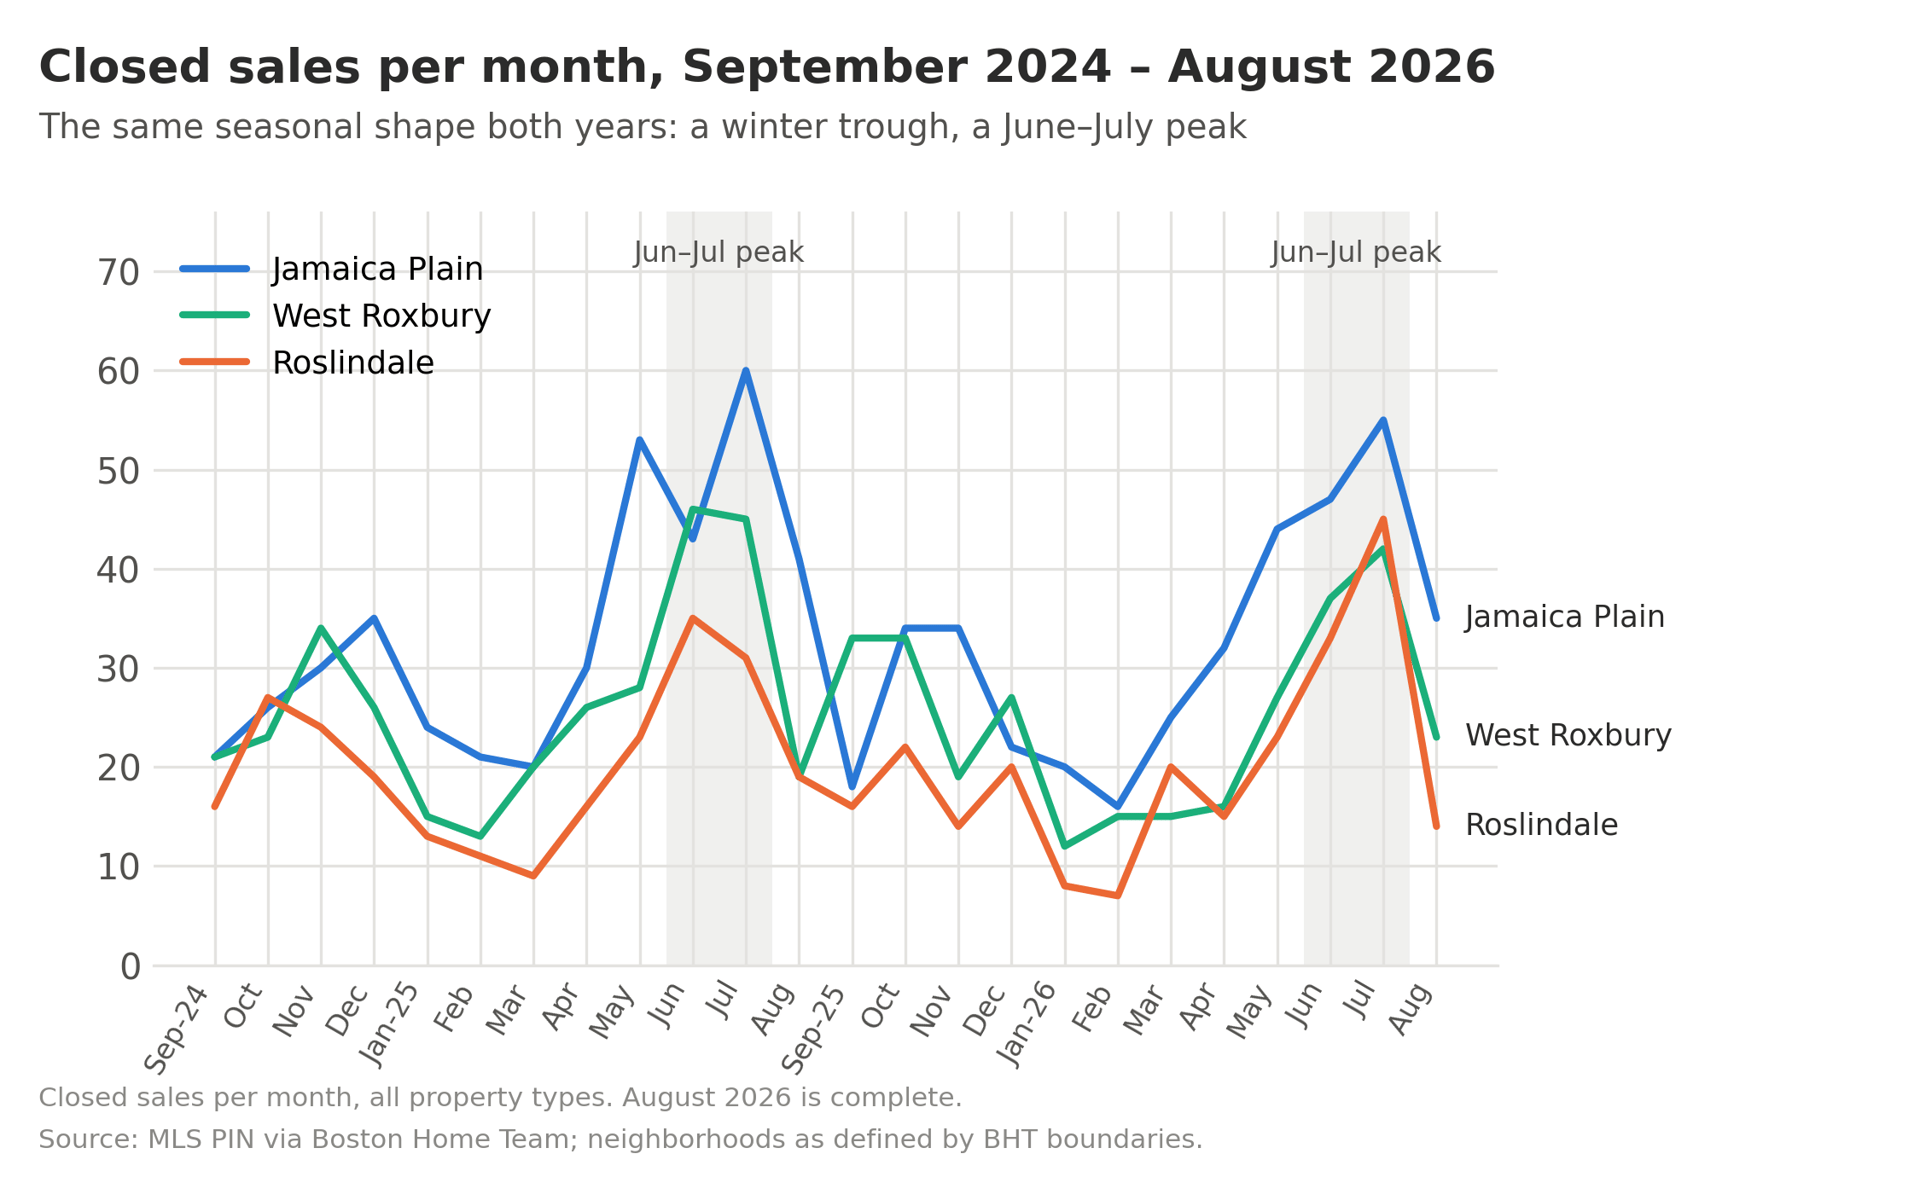
The same seasonal shape both years across Jamaica Plain, West Roxbury and Roslindale. August 2026 is complete.
So a September reading is taken on the downslope of the year, not at its peak. That is true for all nine cells equally, which is why they are still fair to compare against each other — but it is worth holding in mind before reading any one of them as a permanent condition.
What This Means for You
The Numbers Are One Thing. The Experience Is Another.
BJ presented a thorough analysis of the market, gave expert advice on physical improvements to make, and marketed the listing successfully. The house sold within one week at a price 10% higher than we thought we would receive — all during a recession.
After interviewing other JP realtors, I chose BJ because of his depth of understanding of the market and sophisticated reasoning around timing, pricing, and bidding. The listing process was smooth. BJ was right on with his pricing — I accepted a final offer a few percentage points above listing price.
BJ sold our house in JP in two days with multiple offers. They handled everything seamlessly — showings, analyzing offers, hooking me up with a closing attorney, even coordinating inspectors while I was out of town. Complete confidence in this team. Five stars.
BJ and Meredith provided caring and professional service on the sale of my home under extraordinary circumstances. They recommended and arranged all the services needed, and remained involved and responsive from the time offers were in hand all the way until closing.
How to Read These Numbers
Every figure comes from MLS Property Information Network listing and sales data that we collect, screen and map ourselves, with neighborhood boundaries we draw rather than MLS areas or ZIP codes. Listings are read from a daily archive of the MLS feed and are current as of September 23, 2026. Sale-to-list and pace figures cover the trailing twelve months.
Sales are screened for data errors before anything is computed, and a sale with one unreliable field still counts everywhere except the single measure that field would corrupt. Where a figure is blank, it is blank because the sales behind it are too few to carry meaning — three qualifying sales for a days-to-offer median, ten for a distribution. Nothing at the top of the market is trimmed, because a bidding war is a real transaction.
Market Temp is computed per property type and never as a blended figure across all three. There is no such thing as a single price or a single market for a neighborhood that contains both a two-family and a condo, and averaging them produces a number that describes neither.
Want the Reading for Your Block?
Considering a move, a renovation, a purchase or an investment decision? A neighborhood-specific pricing and strategy conversation can help clarify the options. No charge, no obligation.
Source: MLS PIN listing and sales data for Jamaica Plain, Roslindale and West Roxbury, current as of September 23, 2026. Collected, screened and mapped by The Boston Home Team · Gibson Sotheby's International Realty.
Statistics are derived from MLS Property Information Network (MLS PIN) listing and sales data collected and processed by The Boston Home Team, and describe groups of past sales; they do not predict future results and may not represent any individual property. Neighborhood boundaries are drawn by The Boston Home Team and may differ from MLS areas, ZIP codes or City planning districts. This post is informational and is not an appraisal, a broker price opinion, or legal, tax or investment advice. If your property is currently listed with another broker, this is not a solicitation. Equal Housing Opportunity.