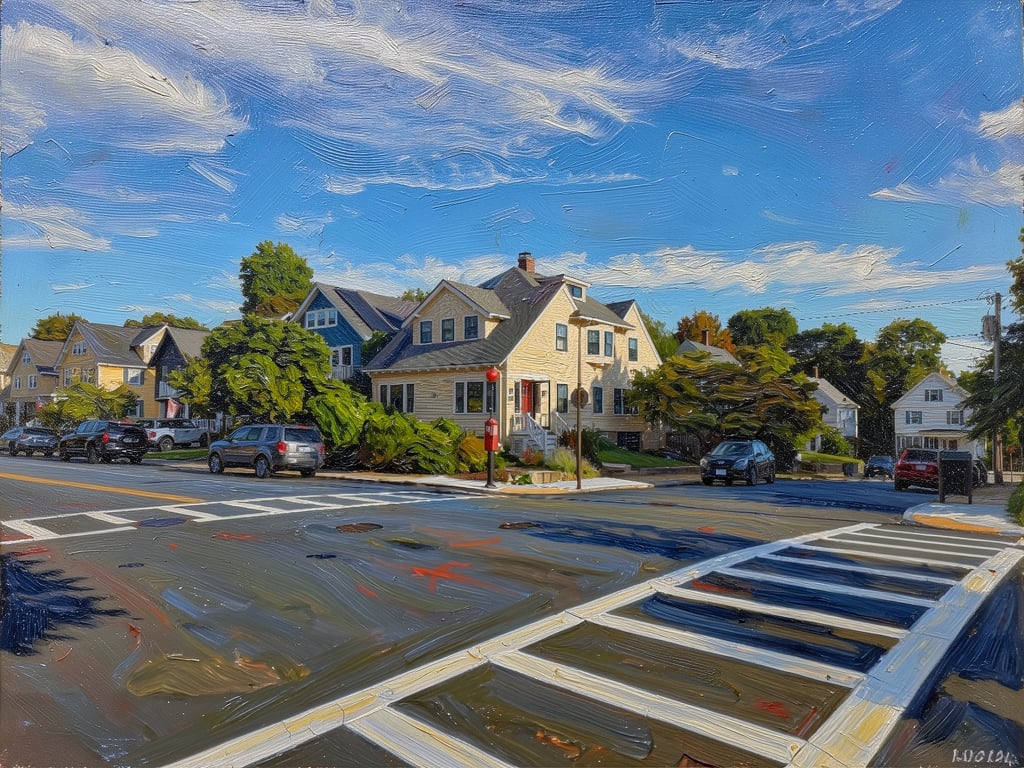
It's Storrow season again. Every year around the first of September, at least one moving truck driver, who trusted a GPS over those giant clearance signs at every entrance, meets a Storrow Drive overpass. Every year we watch the photos circulate with the particular sympathy you can only feel when it isn't your truck. The students are back. Allston Xmas is back: Curbs stacked with the wreckage of ten thousand simultaneous moves — the mattresses, the particleboard bookshelves that didn't survive a second disassembly, the lamp that someone decided wasn't worth the U-Haul space.
More than any other time during the year, it's the one week the city's turnover is visible from the sidewalk. We'll get to the Rental market next week when the dust settles.
Underneath it, the quieter turnover has been running all summer. Between June and August, 10,803 homes closed across the 145 Greater Boston cities, towns, and neighborhoods we track. That's within a percent of last summer and up slightly on 2024. On volume alone, you'd call it a market that didn't do much.
The volume isn't the real story.
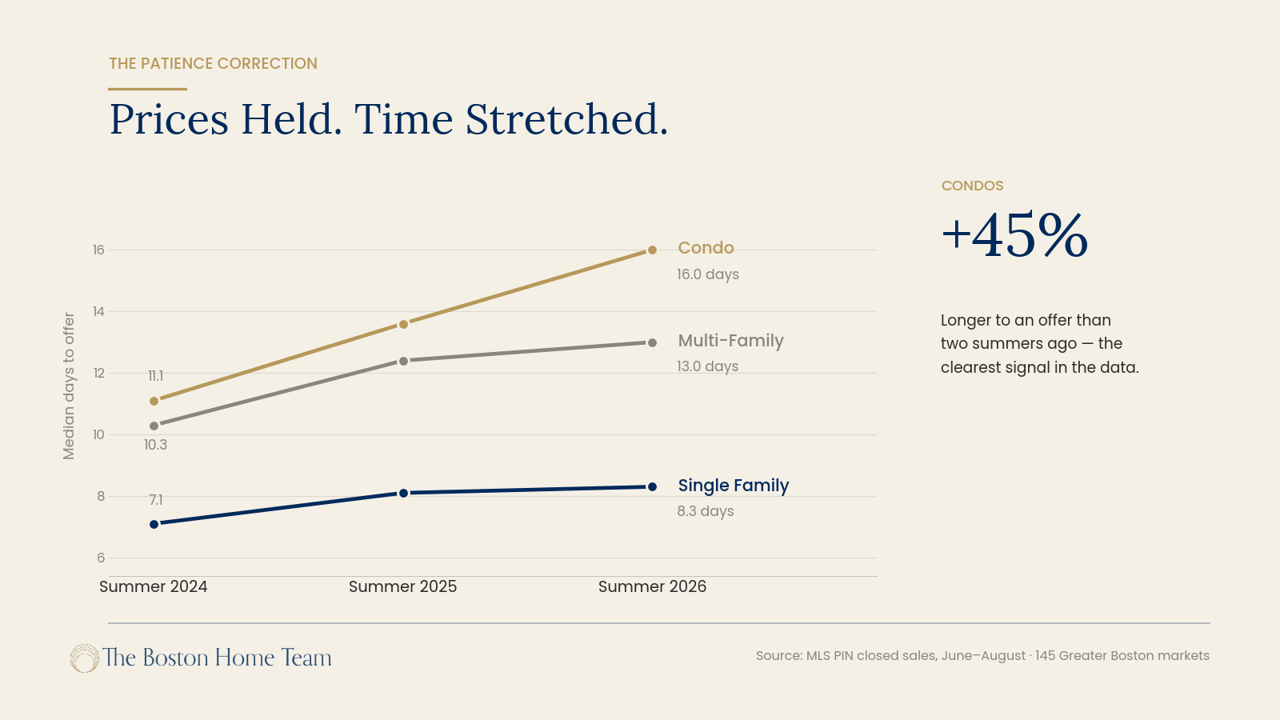
Prices Held. Time Stretched.
Here's the finding that shows up in every property type, against both comparison years, without a single exception: prices went essentially nowhere, and everything took longer.
Single-family median prices are up 1.4% year-over-year and 7.7% against summer 2024. Condo medians are up 2.2% year-over-year and down half a percent over two years. Multi-family medians are down 4.7%. Add it up and the price picture across three summers is a flat line with noise on it.
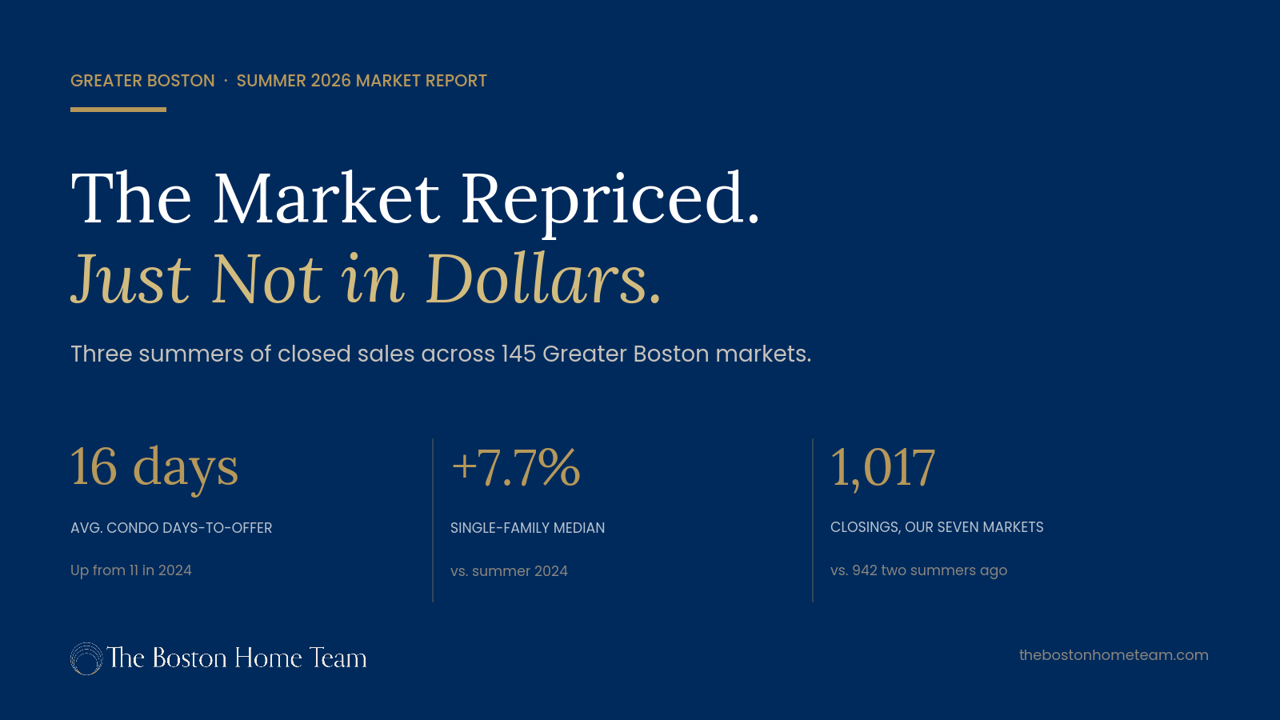
Now look at the clock. Average days-to-offer on single-family homes went from 7.1 in summer 2024 to 8.1 last summer to 8.3 this summer. Condos went from 11.1 to 13.6 to 16.0 — a 45% increase over two years. Multi-family went from 10.3 to 13.0. Sale-to-list ratios eroded in all three segments over the same stretch, with condos crossing below 100% for the first time in the window, at 99.5%.
That combination — stable pricing, lengthening timelines, softening sale-to-list — describes a specific kind of market. Not one that's cracking. One that's being rationed by carrying cost. With the 30-year fixed sitting at 6.87% as of August 31 and the cost of nearly everything else running higher than it was two years ago, the buyers who are still transacting are transacting at close to last year's prices. There are just fewer of them showing up in any given week, so the same house takes longer to find its buyer.
Sellers who priced to that reality did fine this summer. Sellers who priced to 2022 waited.
The Full Picture, June Through August
Every closed sale across all 145 markets we track, by property type, for the same three-month window in each of the last three years. Same window, same geography, no seasonal adjustment needed.
Metric | Summer 2026 | Summer 2025 | Summer 2024 |
|---|---|---|---|
Closings | 6,140 | 6,234 | 5,988 |
Median price | $1,031,799 | $1,017,093 | $958,181 |
Price per sq ft | $449.32 | $441.36 | $430.93 |
Sale-to-list | 101.6% | 101.4% | 102.6% |
Days to offer | 8.3 | 8.1 | 7.1 |
Metric | Summer 2026 | Summer 2025 | Summer 2024 |
|---|---|---|---|
Closings | 3,883 | 3,878 | 3,808 |
Median price | $711,054 | $696,240 | $714,942 |
Price per sq ft | $605.01 | $608.41 | $614.51 |
Sale-to-list | 99.5% | 99.8% | 100.5% |
Days to offer | 16.0 | 13.6 | 11.1 |
Metric | Summer 2026 | Summer 2025 | Summer 2024 |
|---|---|---|---|
Closings | 780 | 773 | 812 |
Median price | $1,081,904 | $1,135,026 | $1,102,772 |
Price per sq ft | $381.41 | $388.51 | $380.30 |
Sale-to-list | 100.0% | 100.6% | 101.4% |
Days to offer | 13.0 | 12.4 | 10.3 |
Source: MLS PIN, closed sales June 1 – August 31, across 145 Greater Boston cities, towns, and neighborhoods. Medians and averages are volume-weighted across markets.
The condo line is the one to watch. Median prices are holding, price per square foot is drifting slightly negative, and days-to-offer has climbed 45% in two years. That's not a price correction. It's a patience correction.
Our Seven Markets Outran the Region
We track the whole region, but here are seven of the markets where we spend most of our time: Jamaica Plain, Roslindale, West Roxbury, Hyde Park, Brookline, Cambridge, and Somerville. Together they produced 1,017 closings this summer against 986 last summer and 942 in 2024 — up 3.1% year-over-year and 8.0% over two years. The region as a whole was close to flat over the same stretch, down 0.8% year-over-year and up 1.8% on two years. These seven grew several times faster than the market around them.
Condos did all of that work. Condo closings across the seven are up 7.0% year-over-year and 12.6% over two years, against a region where condo volume was essentially unchanged. Single-family was down 1.1%; multi-family was down 6.6%.
The speed gap is the more interesting number. Region-wide, condo days-to-offer hit 16.0 this summer. Across these seven, it was 13.6. Both slowed, but the region slowed more, and the gap widened. Whatever's cooling the condo market at the metro level is hitting these seven with less force.
Price per square foot, summer 2026, markets with 10+ closings:
Market | Single Family | Condo | Multi-Family |
|---|---|---|---|
Cambridge | $995.50 | $926.50 | $633.28 |
Somerville | $694.06 | $750.94 | $492.42 |
Brookline | $693.52 | $815.60 | — |
Jamaica Plain | $687.98 | $638.96 | $438.61 |
Roslindale | $569.77 | $517.22 | $386.98 |
West Roxbury | $511.49 | $530.14 | — |
Hyde Park | $450.07 | $504.26 | — |
Dashes indicate segments with fewer than 10 closings this summer — real, but too thin to rank.
One number in that table needs a footnote. Roslindale condos posted the largest two-year volume gain of any condo market in the group — 46 closings this summer against 27 in 2024, up 70% — while price per square foot fell 13.5% year-over-year against a median that barely moved. That's larger units selling at similar prices, not a market losing value. Over two years, both measures are flat.
The Best Three Months in the Group
Roslindale single-family had the strongest summer of any segment across the seven, and it wasn't close.
Thirty-three single-family homes closed, up from 29 last summer and 31 in 2024. Median price came in at $942,000, up 14% year-over-year and 10.8% over two years. Price per square foot hit $569.77 — up 8.8% from last summer and up 25.7% from summer 2024. Days-to-offer dropped from 10 to 7. Sale-to-list moved up to 102%.
That's the full sweep: more sales, higher prices, faster, and above ask. Only one other segment in the seven managed volume up with time down and sale-to-list up, and it was Jamaica Plain single-family — up 7.4% on volume, but with prices essentially flat.
The two-year $/sq ft number is the one worth sitting with. A quarter of appreciation in twenty-four months, in a market where the regional single-family figure moved 4.3% over the same stretch. Roslindale spent a long time being described as the affordable alternative to its neighbors. That description is expiring.
Roslindale Single Family Market:
Source: MLS PIN, single-family closed sales in Roslindale (02131), June–August 2026.
Down Across Every Property Type
Brookline was the only market in the seven where volume fell in all three segments.
Single-family closings dropped from 43 to 31. Condos went from 156 to 132. The multi-family market went from eleven trades last summer to two. We won't put a price on that last one — two sales tell you nothing about value, and we'd rather say so than publish a number we don't trust. But the count itself is the point, and it's the third data point in the same pattern.
Single-family is where there's enough volume to read the pricing, and it reads soft. Median price fell 16.7%, from $2,850,000 to $2,375,000. Price per square foot came down 8.9%. Days-to-offer doubled, from 13 to 26 — the largest single-year jump in the group. Sale-to-list settled at 98%, meaning the average Brookline single-family sold below its asking price this summer.
Two things to keep in proportion. First, a 16.7% median drop on 31 sales carries mix effects; $/sq ft fell less than the median did, which means part of that gap is what sold rather than what things are worth. Second, Brookline's two-year volume figure is only down 1.8% — last summer was unusually strong, and some of this year's decline is measured against that.
Still, twenty-six days to an offer in a market that took thirteen a year ago is a real change in buyer behavior, not a composition artifact.
Two Markets Up on Volume, Moving in Different Directions on Price
Cambridge and Somerville both had strong summers on volume and told opposite stories on price.
Metric | Cambridge | Somerville |
|---|---|---|
Total closings | 268 (+29.5%) | 209 (+20.8%) |
Two-year volume | +28.2% | –1.4% |
SF closings | 50 (+56.3%) | 22 (+10.0%) |
SF median | $2,470,000 (–6.4%) | $1,112,500 (–32.6%) |
SF $/sq ft | $995.50 (+0.5%) | $694.06 (+9.4%) |
Condo closings | 192 (+23.9%) | 141 (+36.9%) |
Condo $/sq ft | $926.50 (+0.3%) | $750.94 (+4.2%) |
Condo days-to-offer | 14.0 | 12.0 |
Cambridge posted the largest volume increase of the seven and did it across all three property types. Fifty single-family closings against 32 last summer is a 56% jump in a market that rarely has fifty houses to sell.
Somerville's numbers need a translation. That 32.6% drop in single-family median looks alarming and isn't what it appears to be. Price per square foot rose 9.4% over the same period. When the median falls hard while $/sq ft climbs, smaller homes sold — not cheaper ones. Twenty-two sales is a thin enough sample that a handful of large properties in either year swings the median several hundred thousand dollars. The per-foot number is the honest one, and it says Somerville single-family got more expensive this summer.
The condo comparison needs no translation. Somerville condos were up 36.9% on volume with the fastest days-to-offer of the seven at 12.0, and $/sq ft up 4.2%. That's the strongest condo performance in the group in a summer when regional condo volume barely moved at all.
Somerville has spent a decade making itself easier to live in without a car, and the bike network is, in our opinion, the best in Greater Boston. Union Square is still an obstacle course of street and sidewalk work, and the frustration is legitimate — but the through line is that people keep choosing to buy there anyway. Olivia's Kitchen opened in Ball Square this year and is worth your time.
Multi-Family Cooled Everywhere
Multi-family was the one property type that went backward on all three measures this summer. Region-wide: 780 closings against 812 two summers ago, median down 4.7% year-over-year, price per square foot down 1.8%, sale-to-list back to exactly 100% from 101.4% in 2024, and days-to-offer up from 10.3 to 13.0.
Across the seven, multi-family volume was down 6.6% year-over-year. Somerville — the deepest multi-family market in the group at 46 closings — was down 8% on volume, down 10.2% on median price, with days-to-offer up and sale-to-list slipping. Roslindale was down 22% on volume. Cambridge was the exception, up 30% on volume with median up 10.7%, though its price per square foot was down over two years, which points to larger buildings trading rather than higher values.
This is the segment where higher rates bite hardest. Multi-family buyers are running the math on carrying cost against rents in a way that owner-occupants don't, and at 6.87% that math is tighter than it was.
The rental side of that math moved the other way this summer, which changes the picture more than the sales data alone suggests. We're publishing a full rental report next week — it's the first one we've been able to build with live supply data, and the timing around September 1 makes it worth its own piece.
What This Means for You
If you're selling a single-family home this fall: the pricing environment is stable and the timeline isn't. Homes are still selling at or slightly above ask across most of these markets, but the average one takes a bit longer to get there than it did two years ago. Price to the RIGHT comps, not to your neighbor's aspirational listing from June, and you should be fine.
If you're selling a condo: this is where the discipline matters most. Sixteen days to an offer region-wide, sale-to-list under 100%, and price per square foot drifting slightly negative. The buyers are there and they're paying close to last year's prices — but they're comparing you against more options and taking longer to decide. Overpricing costs more this fall than it has in years. The rate at which listings fail to sell is higher than it's been in years.
If you're buying: you have something you didn't have in 2022, which is time. Not necessarily leverage on price — the data doesn't support that — but time to see a property twice, to get the inspection you want, and to write an offer that isn't a panic. Use it.
If you're a multi-family owner thinking about selling: the window that was open this spring has narrowed. Volume, pricing, and speed all moved against you this summer. That's not an argument to rush, but it is an argument to have a real conversation about timing before spring. Weight the pros and cons of condo conversion before you commit to listing as a multi-family.
If you own in Roslindale: single-family values there are up more than 25% per square foot in two years, the largest two-year move in any market we track closely. If you bought before 2024, your equity position has changed more than you probably realize. Roslindale's single family is crushing 2026.
The Numbers Are One Thing. The Experience Is Another.
When the Fed began to raise rates, we began to panic. The team pivoted quickly, sped up our timeline, and strategized a listing plan that would drive interest fast. Their knowledge of the market led to multiple offers above our expectations with only one open house.
BJ Ray, through careful analysis and deep knowledge of the market, set an asking price that — combined with beautiful marketing — drew in packed open houses. After being on the market less than a week, we had eight offers and received an offer beyond what we expected.
Meredith was our agent and she took care of everything — staging, open houses, showings — all while I was living abroad. She found us a buyer within 2 weeks of listing at our desired price. The Boston Home Team created all the marketing and was thorough in collecting every detail a buyer would want to know.
BJ and Meredith provided caring and professional service on the sale of my home under extraordinary circumstances. They recommended and arranged all the services needed, and remained involved and responsive from the time offers were in hand all the way until closing.
What We Expect Through Year-End
The 30-year fixed sat at 6.87% on the last day of August. That's the number that governs most of what happens next, and nothing in the summer data suggests it's about to become less important.
Our expectation for the fall: more of what the summer showed. Prices roughly flat, timelines a bit longer than the same period last year, and a widening gap between well-prepared listings and everything else. Fall inventory is thinner than spring by nature, which usually supports pricing on the homes that do come to market. The single-family segment should stay firm. The condo segment is the one to watch — three straight years of lengthening days-to-offer is a trend, not a blip, and if it extends through the fall, the spring conversation about condo pricing is going to look different from this one.
The wild card is the same as it's been for three years. A move toward 6.25% would bring back a meaningful share of the buyers who've been sitting out, and it would show up in the condo numbers first. A move above 7.25% would extend the timelines further without doing much to prices.
Watching a market that looked ordinary in June turn in a strong second half has been the summer's real story around here — in more than one sense. Cambridge and Roslindale did most of the closing.
Wondering Where Your Block Sits?
We ran all 145 markets in Greater Boston through the same three-summer comparison to build this report. If you'd like to see what it says about your specific street, building, or property, we'd welcome the conversation.
Next week we're publishing a companion report on the Greater Boston rental market — including what didn't clear on September 1.
Source: MLS PIN closed sales data, June 1 – August 31, for 2024, 2025, and 2026, covering 145 Greater Boston cities, towns, and neighborhoods. Regional medians and averages are volume-weighted across markets. Segments with fewer than 10 closings in the current period are excluded from rankings and noted where discussed; segments with fewer than 5 are reported by transaction count only, without pricing figures. Mortgage rate as of August 31, 2026, per Mortgage News Daily. The Boston Home Team · Gibson Sotheby's International Realty.