Greater Boston · Q2 2026 Market Report
Greater Boston Q2 2026: By the Numbers
The fastest and slowest markets, the priciest real estate per square foot, the biggest year-over-year movers, and the trophy sales that defined the quarter.
Spring 2026 in ranked form. All rankings use a 10-transaction minimum so thin markets don’t produce misleading “fastest” or “hottest” claims — and a 20-sale minimum for year-over-year price comparisons.
Read more about the Greater Boston's residential market for Q2 2026 here.
6.6
Days to Offer, Ashland — Fastest Single-Family Market
$1,610
Per Sq. Ft., Downtown — Highest Condo Pricing
+35.6%
YoY Price Gain, Weston — Single-Family
$25.8M
9 Atlas Lane, Weston — Top Sale of the Quarter
Speed to Offer · Single-Family
Fastest- and Slowest-Moving Single-Family Markets
Average days to an accepted offer.
⚡ Fastest-Moving
1 | Ashland | 6.6 days |
2 | Maynard | 9.8 days |
3 | Medway | 9.8 days |
4 | Plainville | 10.0 days |
5 | Arlington | 10.1 days |
6 | Pepperell | 10.3 days |
7 | Holliston | 10.3 days |
8 | Chelmsford | 10.3 days |
9 | Marblehead | 10.7 days |
10 | Saugus | 10.8 days |
🐢 Slowest-Moving
1 | Wenham | 50.7 days |
2 | Brookline | 38.0 days |
3 | Concord | 37.6 days |
4 | Groton | 37.5 days |
5 | Salisbury | 36.1 days |
6 | Cohasset | 34.0 days |
7 | Dover | 33.4 days |
8 | Weston | 32.8 days |
9 | Gloucester | 32.7 days |
10 | Millis | 31.1 days |
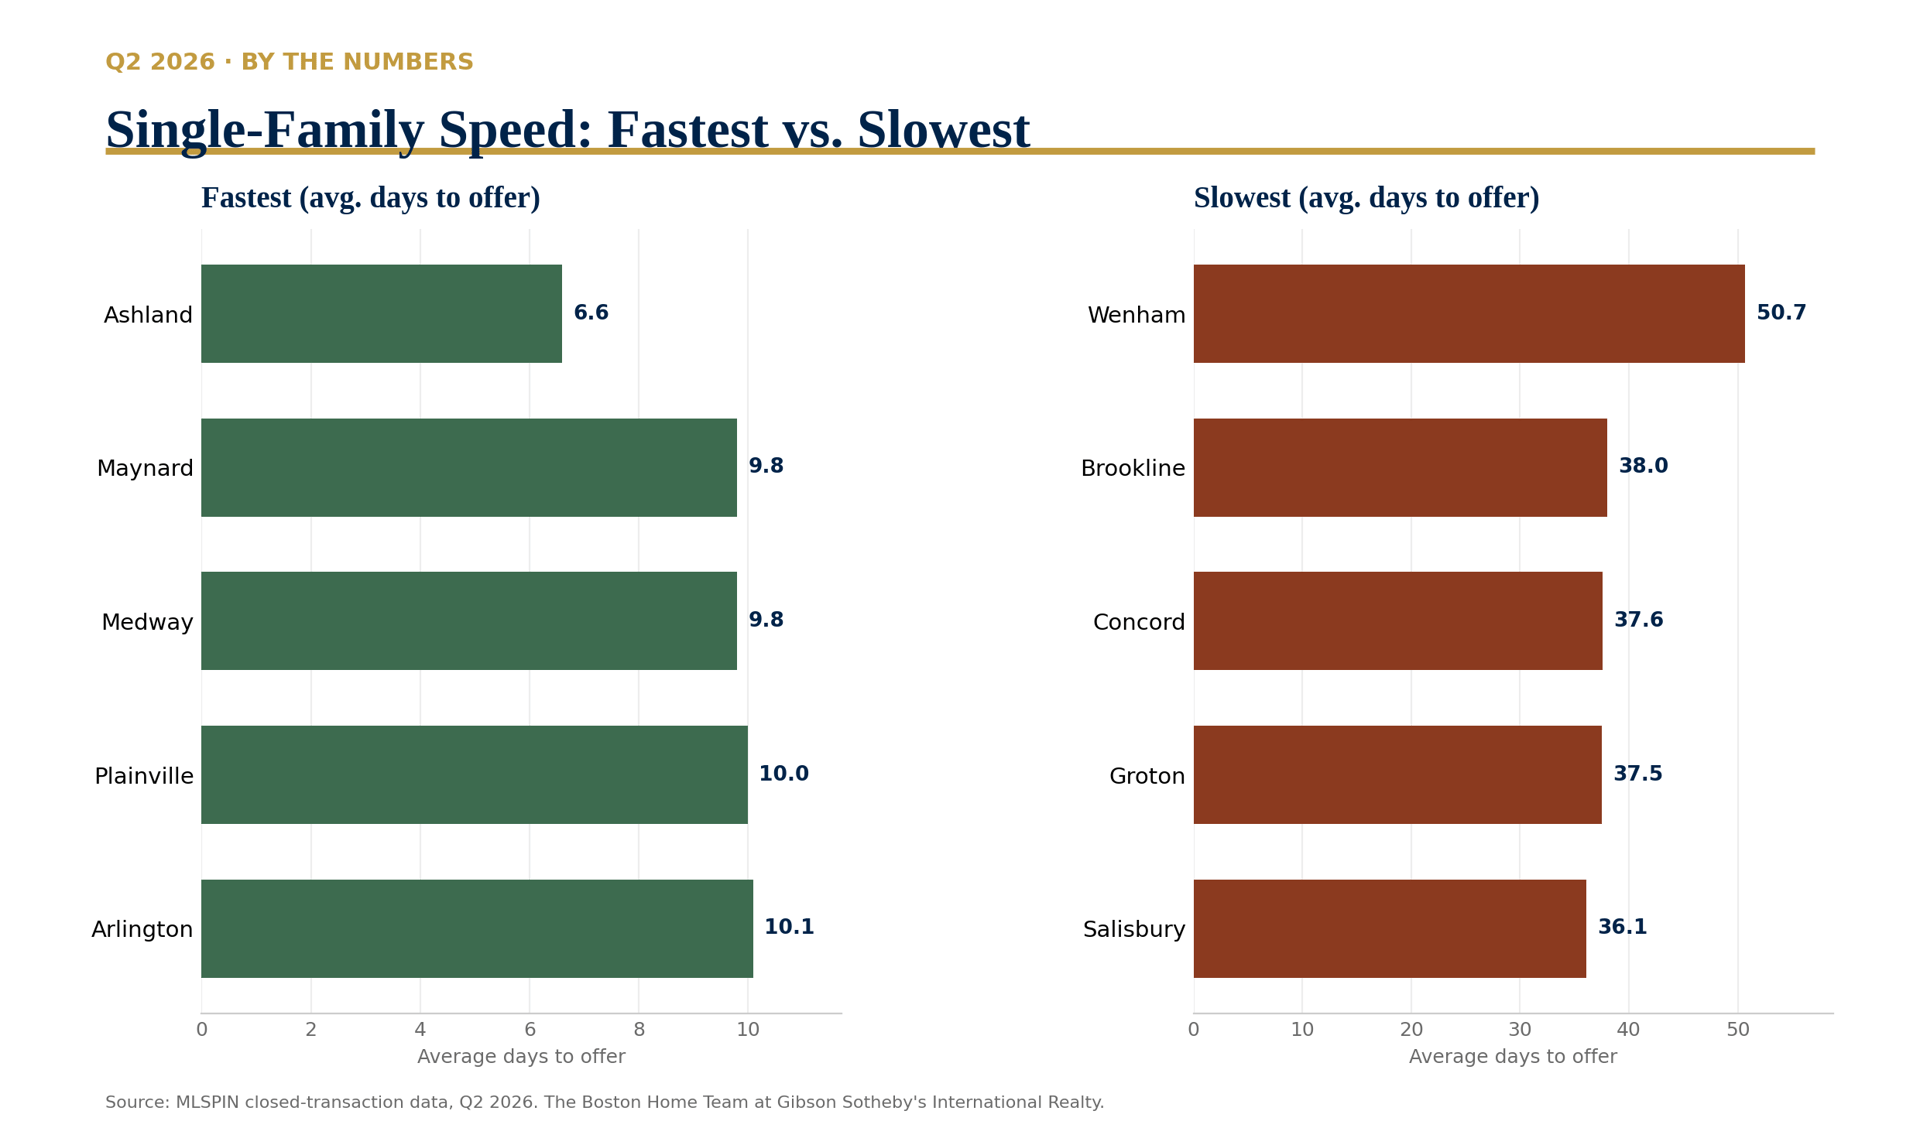
Chart 1 · Single-family speed to offer, fastest vs. slowest markets, Q2 2026
Speed to Offer · Condominium
Fastest- and Slowest-Moving Condo Markets
Where buyers have the least — and the most — leverage.
⚡ Fastest-Moving
1 | Walpole | 9.6 days |
2 | Melrose | 9.9 days |
3 | Ayer | 10.2 days |
4 | Charlestown | 11.1 days |
5 | Medfield | 11.6 days |
6 | Hudson | 12.7 days |
7 | Woburn | 16.7 days |
8 | Belmont | 16.9 days |
9 | Weymouth | 17.1 days |
10 | Winchester | 17.1 days |
🐢 Slowest-Moving
1 | Concord | 55.9 days |
2 | Salisbury | 54.4 days |
3 | Framingham | 53.5 days |
4 | Seaport | 50.7 days |
5 | West Roxbury | 47.6 days |
6 | North End | 47.5 days |
7 | Fenway | 47.1 days |
8 | Milton | 46.9 days |
9 | Back Bay | 46.7 days |
10 | West End | 46.2 days |
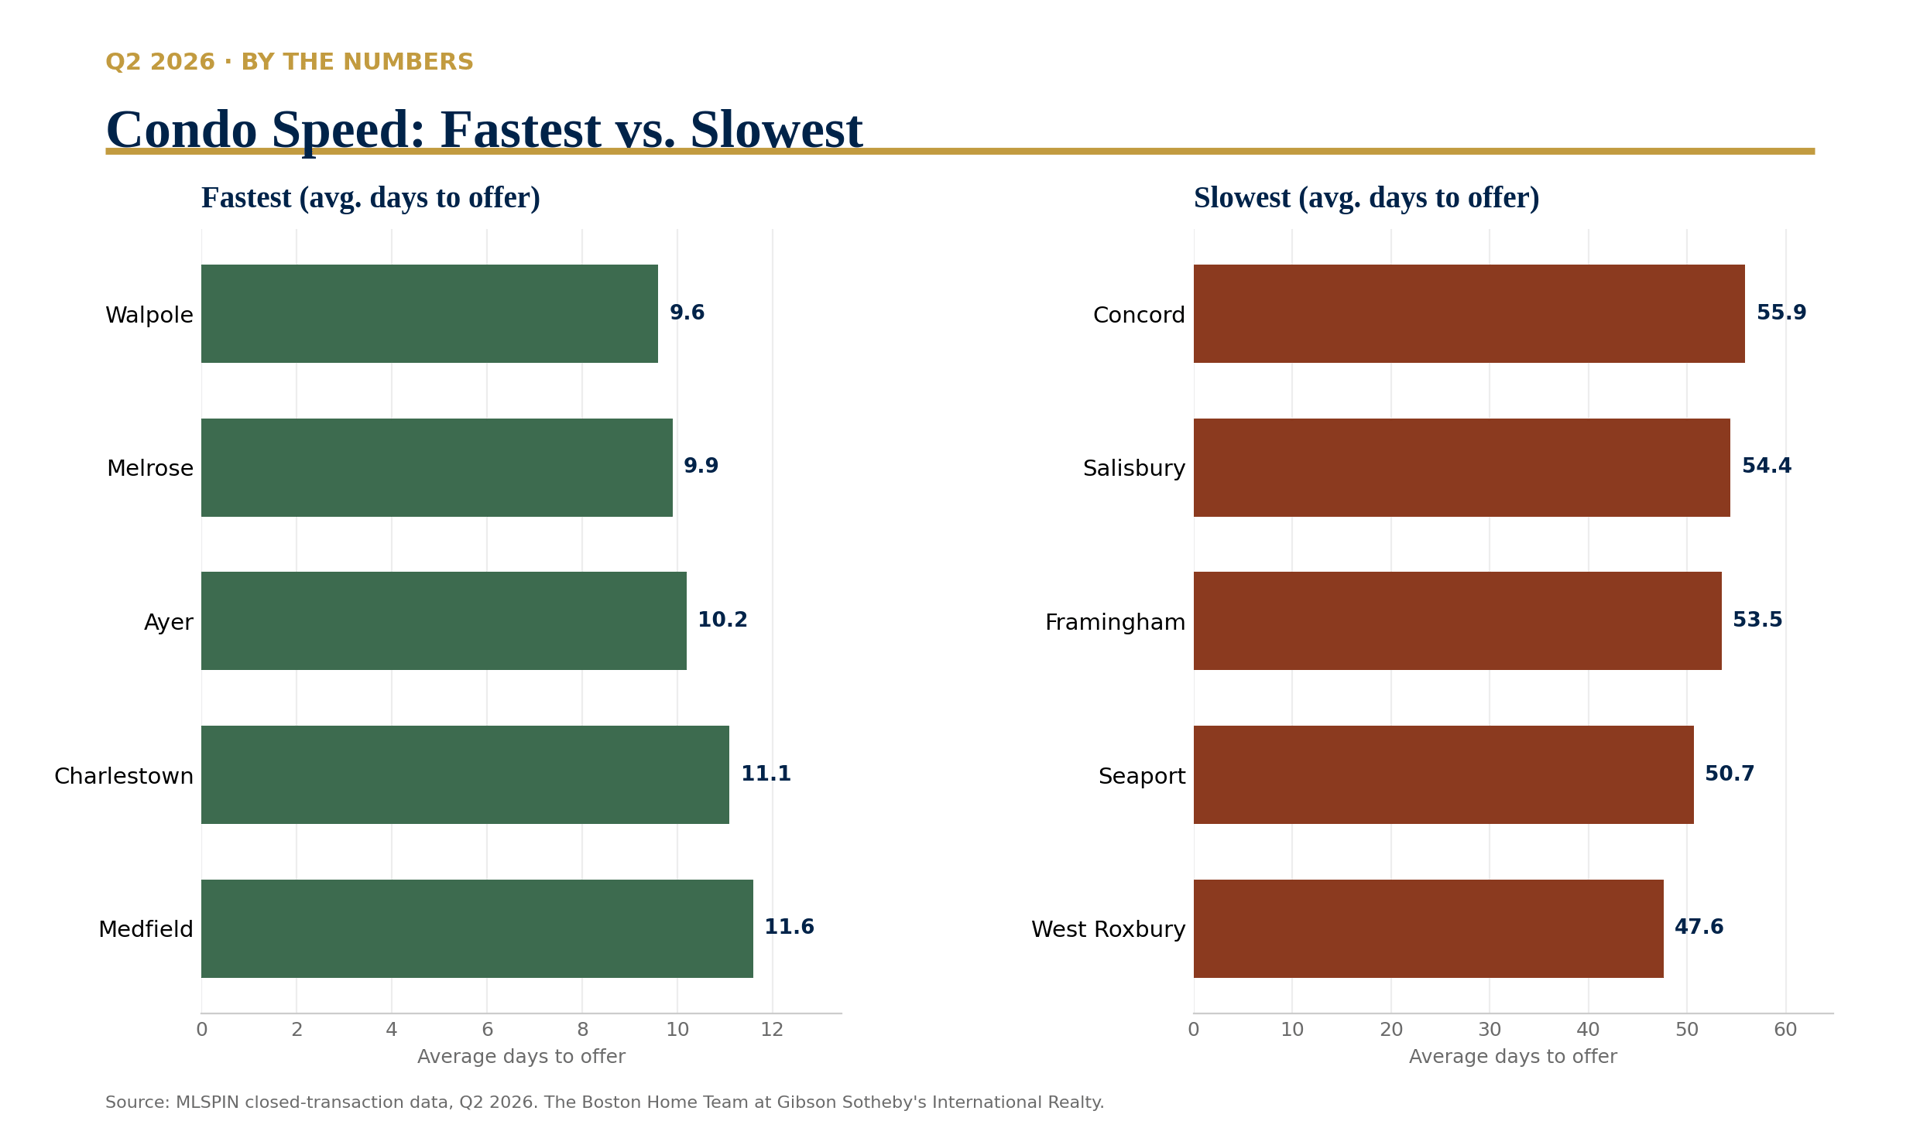
Chart 2 · Condo speed to offer, fastest vs. slowest markets, Q2 2026
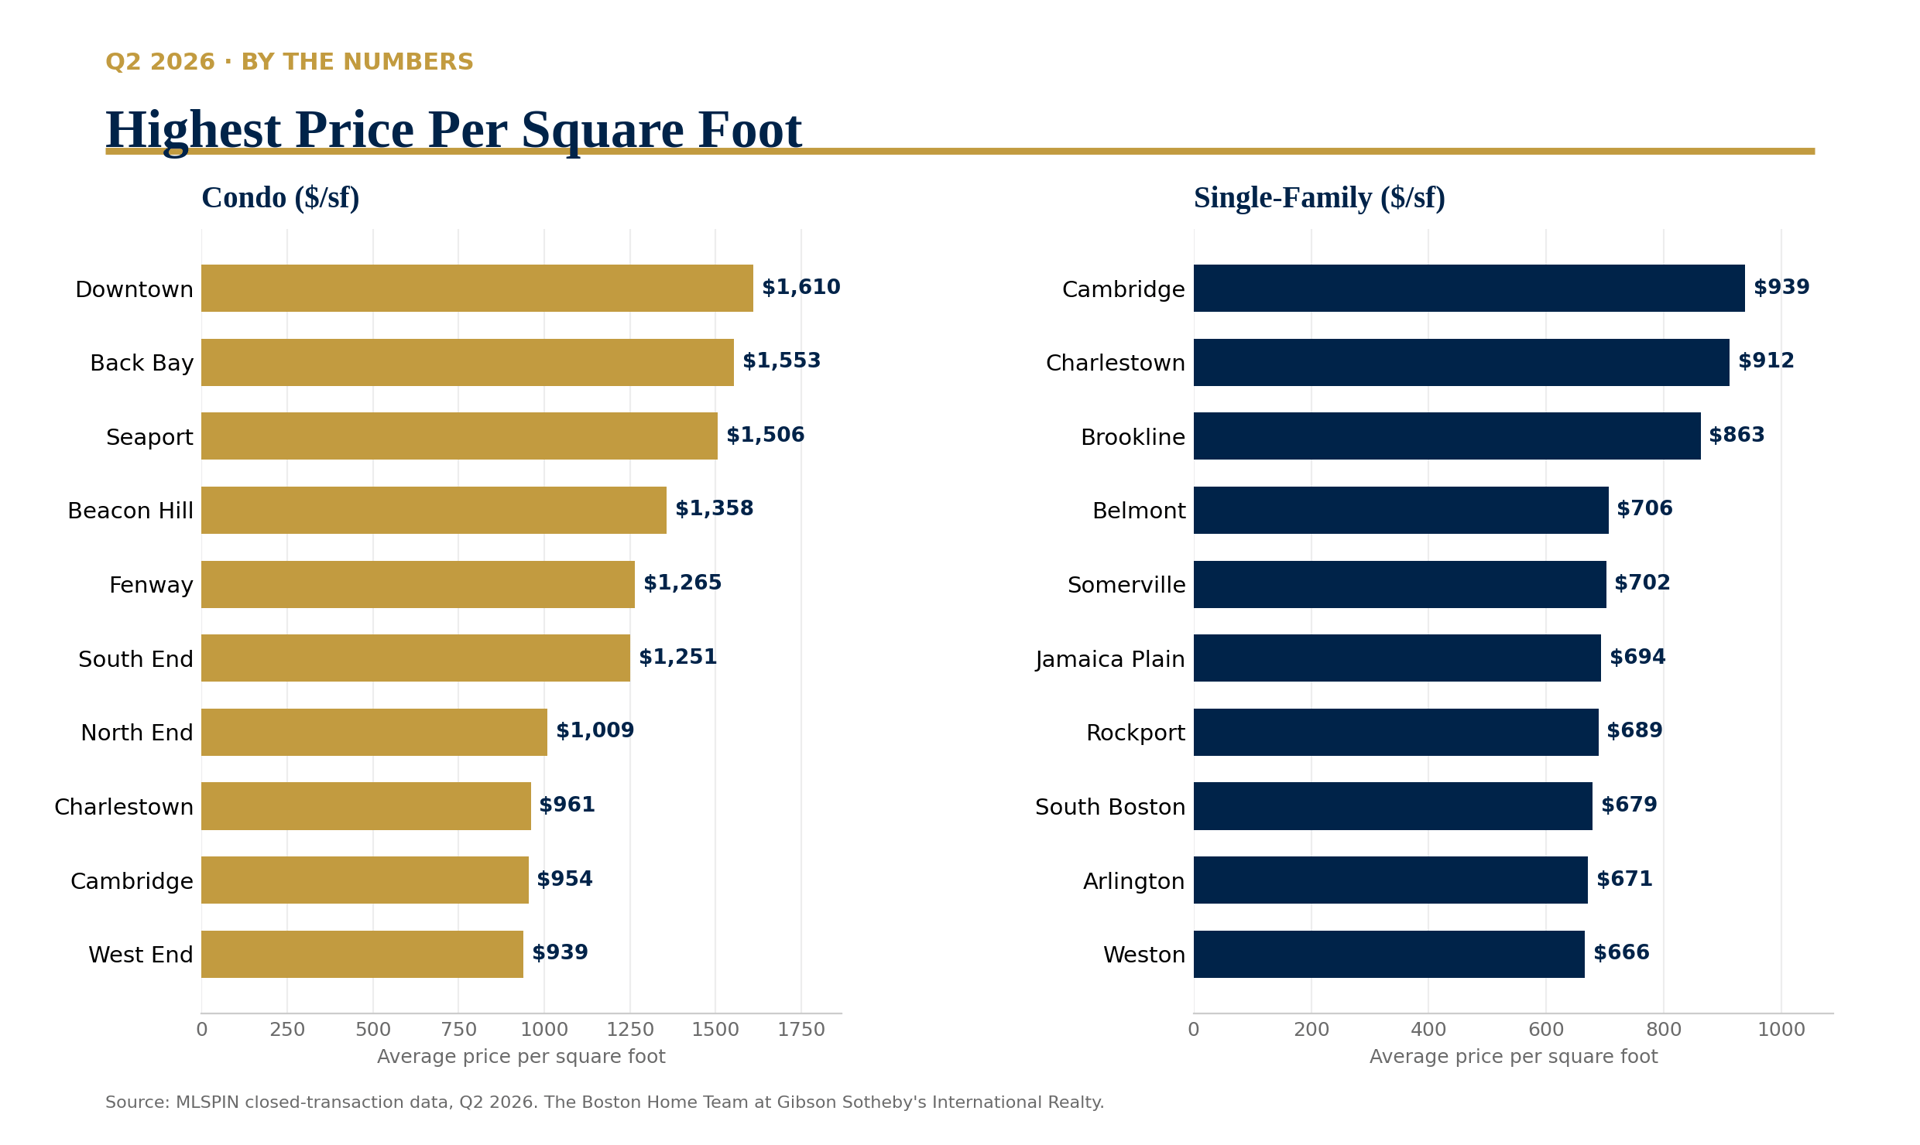
Price Per Square Foot
Highest Prices Per Square Foot: Condo and Single-Family
💎 Condo
1 | Downtown | $1,610/sf |
2 | Back Bay | $1,553/sf |
3 | Seaport | $1,506/sf |
4 | Beacon Hill | $1,358/sf |
5 | Fenway | $1,265/sf |
6 | South End | $1,251/sf |
7 | North End | $1,009/sf |
8 | Charlestown | $961/sf |
9 | Cambridge | $954/sf |
10 | West End | $939/sf |
💎 Single-Family
1 | Cambridge | $939/sf |
2 | Charlestown | $912/sf |
3 | Brookline | $863/sf |
4 | Belmont | $706/sf |
5 | Somerville | $702/sf |
6 | Jamaica Plain | $694/sf |
7 | Rockport | $689/sf |
8 | South Boston | $679/sf |
9 | Arlington | $671/sf |
10 | Weston | $666/sf |
Year-Over-Year Price Change · Min. 20 Sales
Biggest Price Gains, Year-over-Year
🔥 Single-Family
1 | Weston | +35.6% |
2 | Beverly | +28.1% |
3 | Hopkinton | +24.5% |
4 | Groton | +19.2% |
5 | Wayland | +15.9% |
6 | Plainville | +12.6% |
7 | North Andover | +12.2% |
8 | Andover | +12.1% |
9 | Acton | +11.9% |
10 | Wellesley | +10.4% |
🔥 Condo
1 | Fenway | +61.6% |
2 | Dracut | +24.9% |
3 | Walpole | +22.7% |
4 | Lynn | +22.3% |
5 | Back Bay | +21.0% |
6 | South End | +16.3% |
7 | Waltham | +15.6% |
8 | Stoneham | +14.8% |
9 | Salem | +13.6% |
10 | Andover | +13.6% |
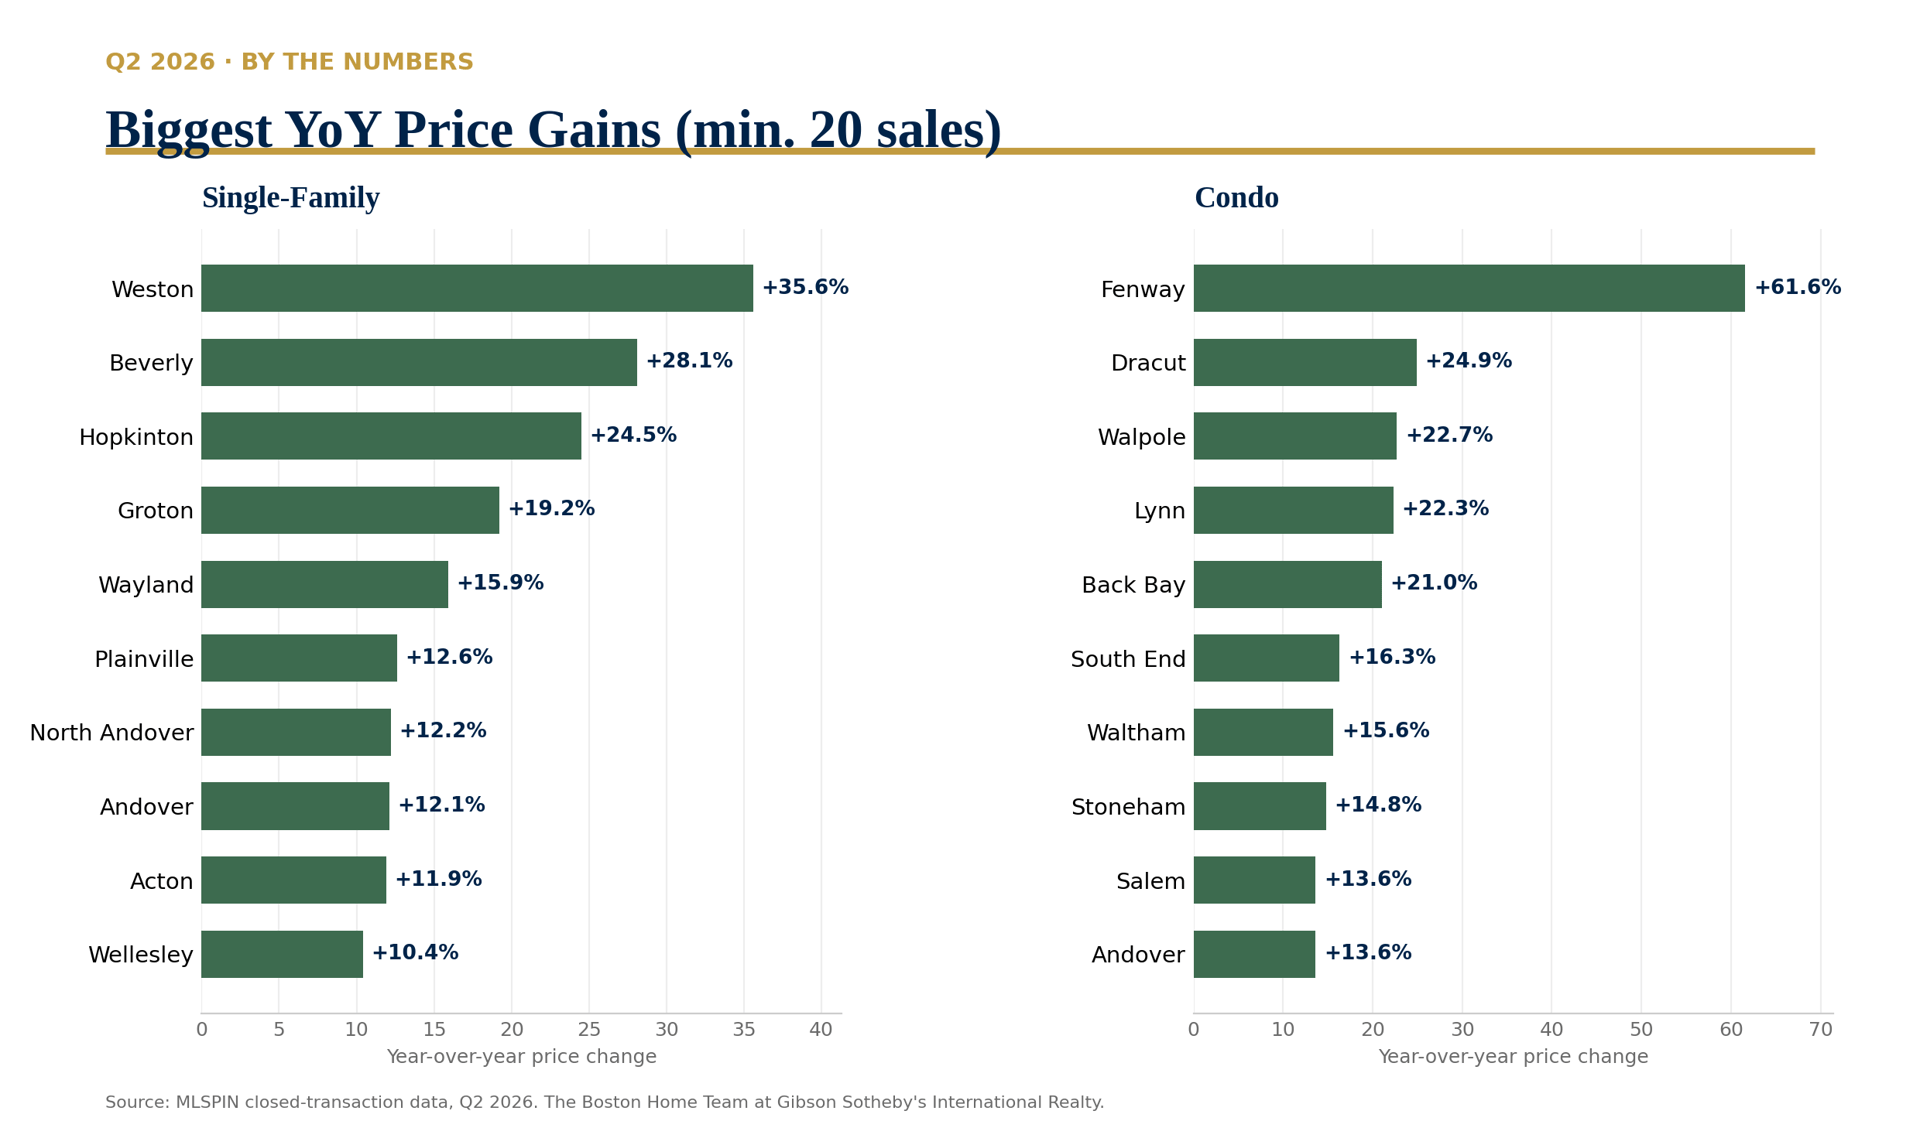
Chart 4 · Biggest price gains, year-over-year, single-family vs. condo, Q2 2026
The High End
The Trophy Sales of the Quarter
The high end ran strong this spring. The biggest closings across all four counties.
One Stat That Says It All
About This Report
BJ Ray · The Boston Home Team
This report ranks Q2 2026 closed MLS sales across Suffolk, Middlesex, Norfolk, and Essex counties — including Ashland, Maynard, Medway, Arlington, Chelmsford, Marblehead, Wenham, Brookline, Concord, Salisbury, Walpole, Melrose, Charlestown, Framingham, Seaport, West Roxbury, Downtown, Back Bay, Beacon Hill, Fenway, South End, North End, Cambridge, Somerville, Jamaica Plain, Weston, Beverly, Hopkinton, Wayland, Andover, Dracut, Lynn, Waltham, Stoneham, Salem, and Weymouth. Rankings are limited to markets with 10 or more transactions, and 20 or more for year-over-year price comparisons, to keep thin markets from producing misleading results. This report is part of an ongoing series tracking real estate conditions across Greater Boston coverage markets published each season by The Boston Home Team at Gibson Sotheby’s International Realty. BJ Ray has tracked Greater Boston real estate data across these markets for 21 years.
Market data reflects MLS-reported closed transactions across Suffolk, Middlesex, Norfolk, and Essex counties, Q2 2026. Rankings limited to markets with 10 or more transactions (20+ for year-over-year price change) to ensure reliability. Each Office is Independently Owned and Operated. Equal Housing Opportunity.
Wondering where your market landed in these rankings?