Three Neighborhoods. Three Different Markets. One Parkway.
The headline: West Roxbury single-families are on fire. Jamaica Plain single-families have gone soft. Condos across all three neighborhoods are holding or rising. And multi-family is quietly the most interesting story in the corridor.
Draw a line along the Arborway from the Forest Hills T station south, let it split at the Casey Overpass intersection, and you've traced the connective tissue of three Boston neighborhoods that share geography, history, and city services — but increasingly diverge when it comes to what buyers are actually doing with their money. This report covers February through May 2026 — four months of closed sales, with one month of meteorological spring still on the clock — and the data is already telling a clear story.
Jamaica Plain, Roxbury, and West Roxbury all sit within a few miles of one another along the emerald-green spine of Frederick Law Olmsted's parkway system. Housing prices, property types, and buyer profiles are genuinely different across the three. But what's striking in the February–May closed-sale data isn't the differences we expected — it's how surgical the divergence has become, cutting cleanly by property type rather than by neighborhood.
Where each neighborhood stands right now
Rising pressure — and a supply problem, not a demand problem
Start here because the signal is cleanest. West Roxbury single-families are selling at 105.2% of list price — fifth-highest SP/LP of any market with meaningful volume in all of Greater Boston through May — and they're doing it in six days. That combination hasn't softened at all compared to last year; SP/LP actually improved slightly (+0.7pp) and DOM held flat.
What changed is volume. Sellers are sitting on the sideline. West Roxbury put only 37 SF closings on the board through May, down 26% from 50 a year ago and from 68 in 2024. So we have a market where competition for available product is intense — buyers are paying over ask quickly — but the inventory that would generate those sales at scale isn't materializing. The $/sq.ft. confirms this is real: $571/sq.ft., up 5% year over year, a genuine per-unit price increase not explained by which houses happened to sell.
The condo side of West Roxbury deserves a footnote. Median price dropped from $660K to $525K year over year, but $/sq.ft. only fell 7% — consistent with a mix shift toward smaller units rather than actual value erosion. Volume held flat at 33 sales. Don't read the median headline as a condo price collapse; the per-square-foot data doesn't support it.
Multi-family is the one soft spot. Only 3 MF closings through May (down from 4 in 2025, 11 in 2024), with an SP/LP of 95.6% and DOM creeping to 39 days. Sample size is too small to draw structural conclusions, but it's a divergence from the SF story worth noting if you're considering a multi-family purchase in this pocket.
Fifth-highest SP/LP of any Greater Boston market with meaningful volume through May. Six-day median DOM. If you own a West Roxbury single-family and have been considering a move, the demand is there to meet you.
A repricing story — not a demand story
Jamaica Plain's single-family market is the most meaningful reversal in the corridor. Two years ago, JP SF was one of the tightest sub-markets in the city — buyers paying over ask in days, SP/LP consistently above 100%. Through May 2026: 97.3% SP/LP, 14-day median DOM, volume down 25%. All three metrics moved the wrong direction simultaneously, and the shift isn't explainable by mix effects.
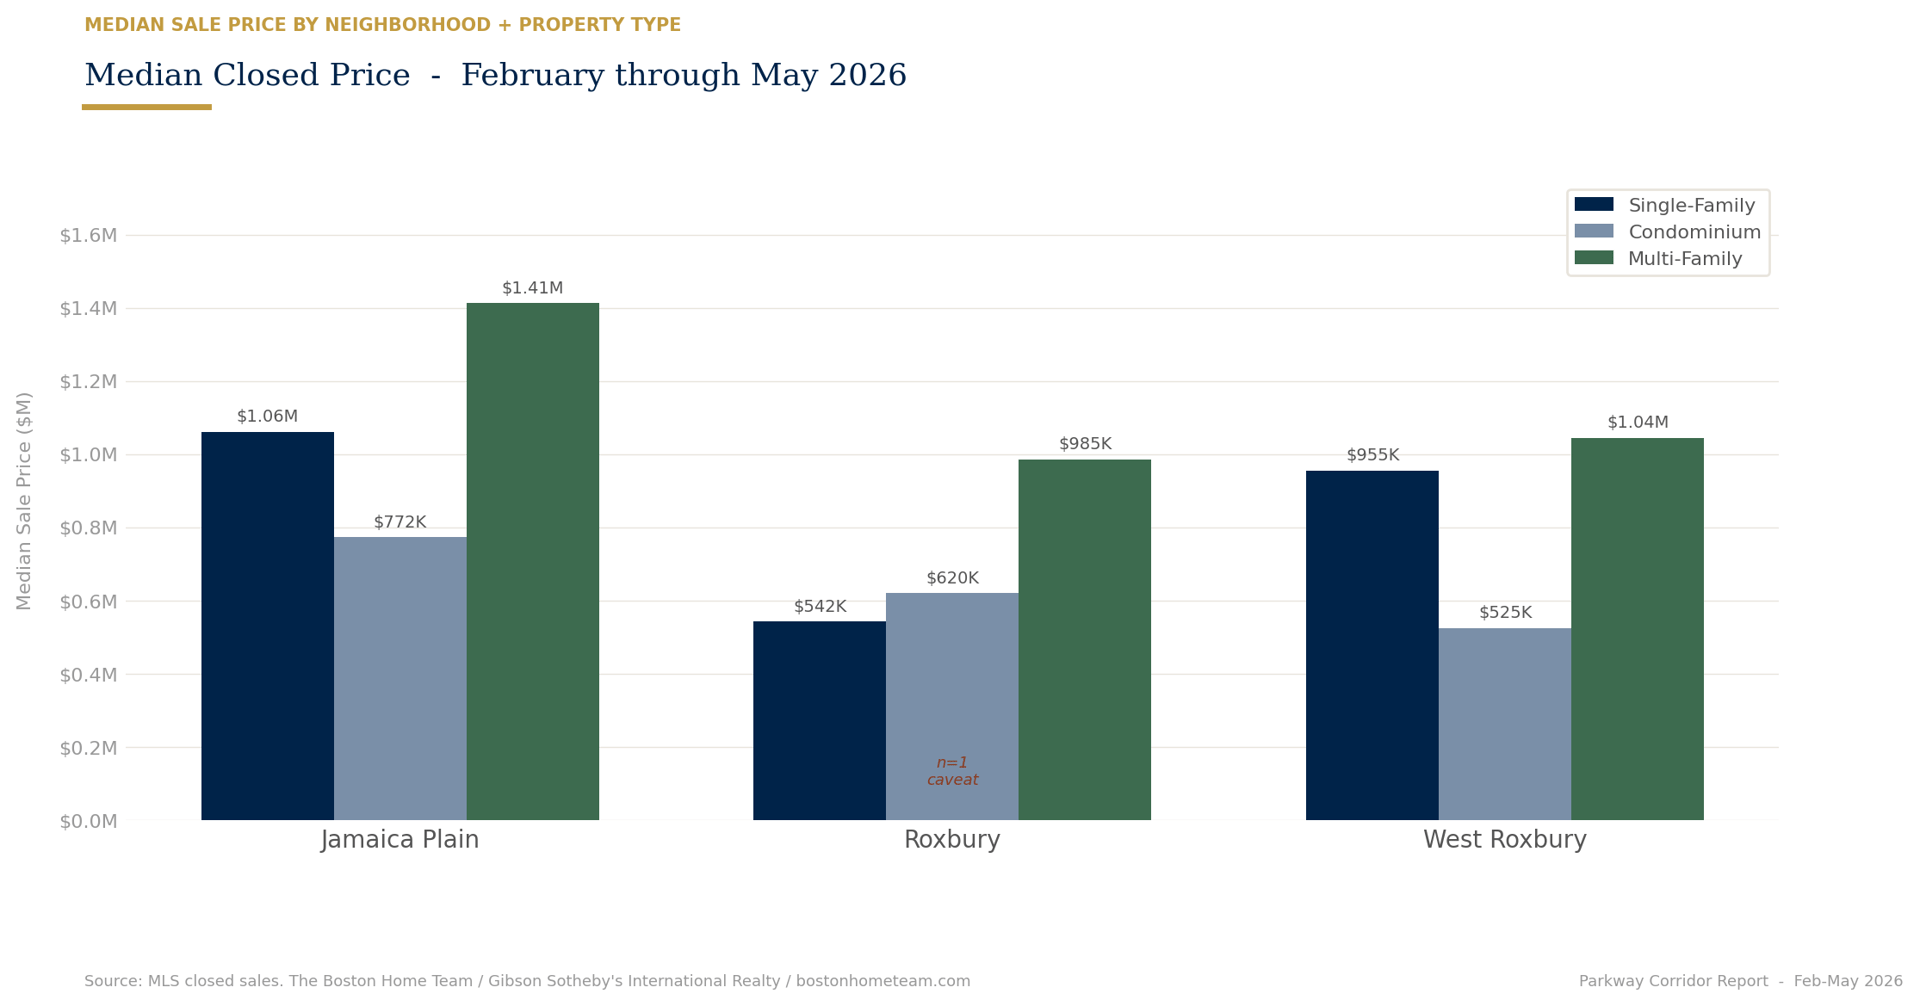
The price-per-square-foot data is key here. JP SF $/sq.ft. fell from $695 to $597 — a drop of 14%. Median price fell 17%. When both metrics move in tandem, that's not different-sized houses selling. That's actual price softening. JP single-family sellers who priced based on 2024 or even early 2025 comps are either cutting or sitting.
What makes this interesting rather than just bearish: the condo market completely disagrees. JP CC is holding firm — 88 closings (essentially flat), SP/LP at exactly 100%, DOM unchanged at 7 days, and median price up 9% to $772,500. Buyers still want to be in Jamaica Plain. They're just not fighting over the single-family product at current pricing.
The multi-family segment is where it gets genuinely compelling. JP MF posted 14 closings through May, up 17% from 12 last year and nearly double the 8 transactions in 2024. Median price is $1.41M — up 8.7% — and DOM is a tight 7.5 days. The two-to-four family market in JP is running its own independent rally, largely invisible to the SF narrative. For investors or owner-occupants considering a two-family, this is a different conversation than the SF data would suggest.
Median: $1.63M → $1.41M
to 97.3% (2026)
SP/LP steady at 100.0%
Mixed signals — and a caveat that matters
Roxbury requires the most context-sensitive reading of the three. Single-family volume is essentially zero through May — one transaction — so the SF data is an anecdote, not a market signal. Don't read the $542K SF median or the 3-day DOM as representative of anything meaningful. With n=1, those numbers reflect a single house.
The condo market is where Roxbury actually trades, and the 2026 picture there is mixed-to-soft. Volume fell 29% (28 to 20 closings), SP/LP slipped to 98.75%, and DOM crept from 21.5 days to 27 days. Median condo price held near-flat at $619,500 (up just 1.1% from $612,500), but $/sq.ft. declined 11%, suggesting a mix shift toward smaller-format inventory. The full three-condition "markets in trouble" flag fires for Roxbury CC: volume down, DOM up meaningfully, SP/LP eroded. It's not a catastrophic reading — 20 closings at 98.75% SP/LP is not a distress scenario — but the directionality is clearly softening.
Multi-family is the most interesting Roxbury story. The MF market had 18 closings — down 10% from 20 but up substantially from 15 in 2024 — with a median price of $985,000. DOM improved from 32.5 to 27 days. The SP/LP of 98.5% is below 100 but not alarming given the price point. For those tracking the multi-family narrative across the corridor: Roxbury MF is somewhere between JP's strengthening story and the general softness of the CC market. Worth watching as a bellwether given the neighborhood's ongoing development pressure.
February–May 2026 vs. prior years
Neighborhood | Type | Vol '26 | Vol '25 | Vol '24 | Med Price '26 | YoY Δ | $/sq.ft. | SP/LP '26 | SP/LP '25 | DOM '26 | DOM Δ |
|---|---|---|---|---|---|---|---|---|---|---|---|
Jamaica Plain | SF | 15 | 20 | 16 | $1,060,000 | −17.2% | $597 | 97.3% | 105.1% | 14.0d | +7.5d |
Jamaica Plain | CC | 88 | 92 | 77 | $772,500 | +8.9% | $643 | 100.0% | 100.0% | 7.0d | flat |
Jamaica Plain | MF | 14 | 12 | 8 | $1,412,500 | +8.7% | $382 | 99.9% | 97.0% | 7.5d | −4.0d |
Roxbury | SF | 1 ⚠ | 5 | 3 | $542,000 | −26.3% | $373 | 103.2% | 100.0% | 3.0d | — |
Roxbury | CC | 20 | 28 | 32 | $619,500 | +1.1% | $459 | 98.8% | 100.0% | 27.0d | +5.5d |
Roxbury | MF | 18 | 20 | 15 | $985,000 | −10.7% | $346 | 98.5% | 97.4% | 27.0d | −5.5d |
West Roxbury | SF | 37 | 50 | 68 | $955,000 | +7.0% | $571 | 105.2% | 104.5% | 6.0d | flat |
West Roxbury | CC | 33 | 33 | 32 | $525,000 | −20.5% | $490 | 100.0% | 100.1% | 18.0d | +12.0d |
West Roxbury | MF | 3 | 4 | 11 | $1,045,000 | −8.1% | $396 | 95.6% | 99.0% | 39.0d | +21.0d |
⚠ Roxbury SF: n=1 this period. Data not statistically reliable for trend analysis. | SP/LP = sale-to-list ratio. DOM = days to accepted offer.
What the data means if you're buying or selling right now
The parkway corridor is telling a nuanced story through the first four months of 2026's spring selling season — one that resists simple summary but rewards careful reading. The divergence between property types is sharper than the divergence between neighborhoods. Condos are broadly healthy across all three markets. Multi-family is strengthening where there's volume to measure. Single-families are where the action — and the risk — is concentrated.
West Roxbury's SF market is functioning exactly as a healthy supply-constrained market should: prices up, DOM tight, buyers competitive. The issue there is that fewer sellers are listing, compressing the transaction count even as demand holds firm. If you own a West Roxbury single-family and have been contemplating a move, the demand is there to meet you. The competition is among buyers, not sellers.
Jamaica Plain SF requires a reset in expectations for anyone using 2023 or 2024 as their pricing reference. The metrics are unambiguous about the direction: softer SP/LP, longer DOM, declining $/sq.ft. But JP hasn't stopped being JP — the location, the density of amenities, the T access, the community character. The condo market says buyers still want in. The SF softness is a pricing story, not a demand story. There's a meaningful gap between what some sellers want and what the market is paying, and that gap is showing up in DOM and SP/LP.
For buyers and sellers along this corridor, the takeaway is simple: know which market within the market you're in. A West Roxbury SF, a Jamaica Plain condo, and a JP two-family are three separate market realities right now — even though they sit within a mile of each other along the same parkway.
"A West Roxbury SF, a Jamaica Plain condo, and a JP two-family are three separate market realities right now — even though they sit within a mile of each other along the same parkway."
This report covers Jamaica Plain, Roxbury, and West Roxbury using closed MLS sales data from February through May 2026, compared against the same period in 2025 and 2024. It covers single-family, condominium, and multi-family transactions. Roxbury SF data (n=1) is excluded from trend analysis and flagged accordingly. This report is part of an ongoing series tracking real estate conditions across Greater Boston coverage markets published each season by The Boston Home Team at Gibson Sotheby’s International Realty. BJ Ray has tracked Greater Boston real estate data across these markets for 21 years.
The Boston Home Team has been tracking Jamaica Plain, Roxbury, and West Roxbury for years. If you're trying to understand what this data means for your specific situation — whether you're buying, selling, or deciding whether now is the right time to move — that's the conversation we're built for.