Greater Boston Single-Family Market Update: Q4 2025
(and What It Might Mean for Q1 2026)
You may not be surprised to hear that we agents are asked "How's the market?" fairly regularly. The typically broad responses we have are never satisfying. "It's busy." "It's slow." "It's crazy." "It's hard to say". But if you were to ask an agent a more specific question like:
“How was the single-family market in Q4 2025 — and what can we expect in Q1 2026?”
Well, you just might get a more satisfying response. And if you're here on this page because you'd like to hear the answer, please read on for a clear, data-driven look at Q4-2025 sales, and how it might shape your decisions for 2026.
How Single-Family Homes in Greater Boston* Performed in Q4 2025
Across Greater Boston*, Q4 2025 single-family activity looked like this:
-
Typical sale price: Around $1.36M
-
Typical price per square foot: About $550/sq ft
-
Average time to get an offer: Roughly 4 weeks (about 29 days)
-
Negotiability: Homes, on average, sold at about 100% of asking price
-
Sales volume:
-
Roughly flat to slightly down vs Q4 2024 (about a 2–3% dip in transactions)
-
About 10% fewer single-family sales than Q3 last year.
-
So: prices held up (and in many cases grew), even as the number of sales softened heading into year-end.
Key takeaway:
Single-family pricing remained resilient in Q4 2025. Buyers saw fewer options and little in the way of big discounts; sellers saw strong pricing but a bit more patience required in some higher-end segments.
*Jamaica Plain, Roslindale, West Roxbury, Needham, Brookline, Dedham, Cambridge, Somerville, Medford, Melrose, Milton, Brighton, Watertown, Waltham, Newton, Belmont, or the Essex County communities of Lynn, Salem, Swampscott, Marblehead, Peabody, and Beverly.
Quick Snapshot: Q4 2025 by County (All Single-Family Sales)
These numbers reflect all MLS** single-family sales in Essex, Middlesex, Norfolk, and Suffolk counties in Q4 2025.
Across all four counties combined (single-family only):
-
About 4,579 single-family sales in Q4 2025, almost even with last year (0.5% less than Q4 2024).
-
That’s roughly 6% fewer sales than Q3 2025 and about flat (–0.5%) vs Q4 2024
-
The average sale price was about $1.20M
-
~1–1.5% higher than Q3 2025
-
~3% higher than Q4 2024
-
-
Homes went under agreement in about 31 days on average, 3 days slower than last year.
-
The average sale-to-list ratio was about 99.8% (so homes sold right around asking overall), trending down from Q4 2024, which was almost 101% of the list.
Zooming in by county:
Middlesex County
-
~2,079 single-family sales in Q4 2025
-
Average sale price: about $1.09M
-
Sales: down roughly 6% vs Q3 2025 and about 1% vs Q4 2024
-
Prices: down about 2% vs Q3, but still ~3–4% higher than a year ago
-
Average days to offer: ~27 days
-
Sale-to-list ratio: around 100.6%
This wasn’t buyers and sellers locked in One Battle After Another—it was a modest easing from Q3’s pace, with prices still stepping higher year-over-year.
Norfolk County
-
~1,079 single-family sales in Q4 2025
-
Average sale price: about $1.10M
-
Sales: roughly 10% fewer than Q3 2025 and essentially flat vs Q4 2024
-
Prices: basically flat vs Q3 (a touch lower), but about 8% higher year-over-year
-
Average days to offer: ~30 days
-
Sale-to-list ratio: just under 100% (about 99.8%)
The price pattern here isn’t some stitched-together Frankenstein of random spikes—it’s the result of steady demand meeting a slightly thinner flow of sellers.
Suffolk County
-
~268 single-family sales in Q4 2025
-
Average sale price: about $2.01M
-
Sales: down roughly 14% vs Q3 2025 and about 1% vs Q4 2024
-
Prices: up nearly 10% vs Q3, and essentially flat vs Q4 2024
-
Average days to offer: ~42 days
-
Sale-to-list ratio: about 97–98% (a bit more room to negotiate)
At first glance, Suffolk can look like the market where some patience get rewarded—high prices, slower pace, more negotiation—but it’s really just what happens when high-end properties take longer to find the right match.
Essex County
-
~1,153 single-family sales in Q4 2025
-
Average sale price: about $942K
-
Sales: effectively flat vs both Q3 2025 and Q4 2024 (down less than 1%)
-
Prices: down about 4–5% vs Q3 and ~3–4% vs Q4 2024
-
Average days to offer: ~31 days
-
Sale-to-list ratio: just over 100% (about 100.2%)
Here, the “Secret Agent” in the data is days-on-market: even with slightly lower prices, homes are still going under agreement in about a month and often a touch over asking.
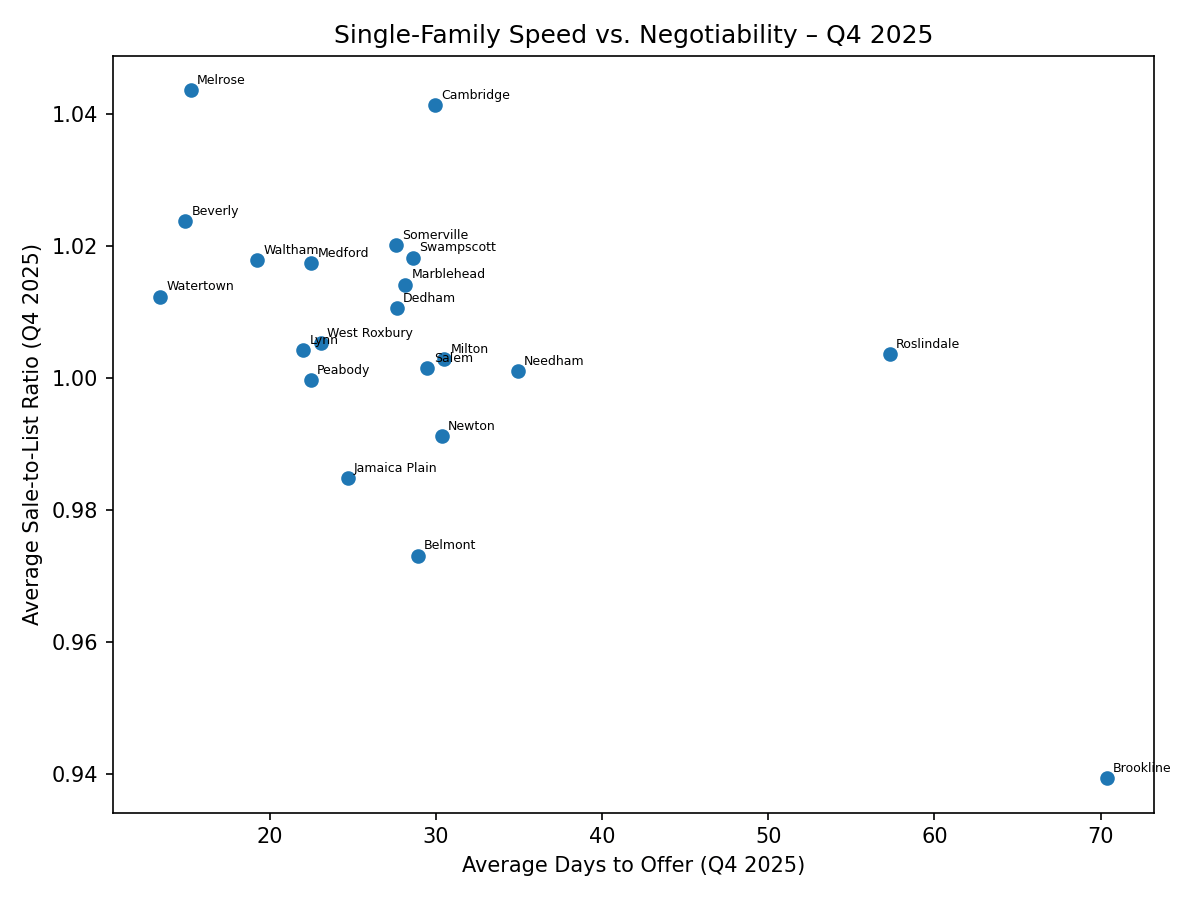
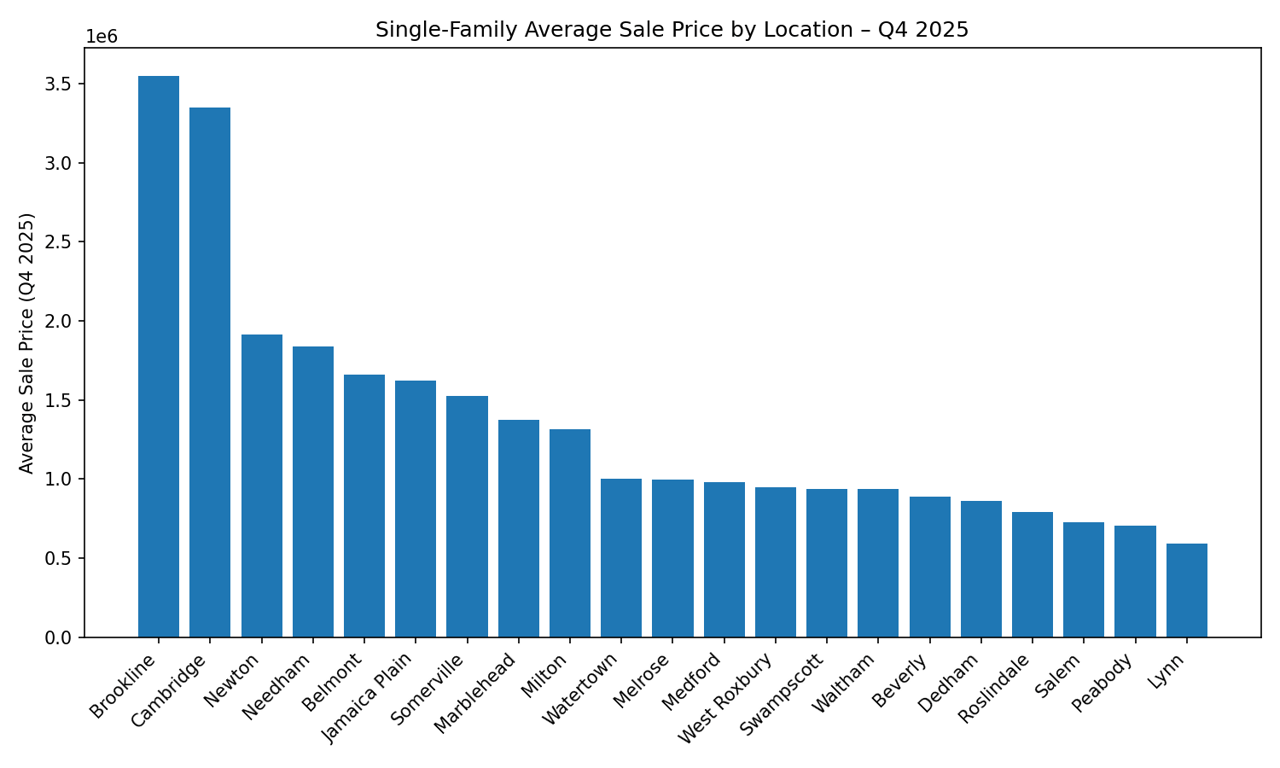
High-Price, Low-Inventory Locations: Brookline, Cambridge, Newton & Needham
Brookline & Cambridge: Luxury Pricing, Very Thin Supply
Brookline single-family (Q4 2025):
-
~22 sales
-
Average sale price: ~$3.55M
-
Average days to offer: ~70 days
-
Sale-to-list: ~94%
-
Prices vs Q4 2024: up about 39%
-
Prices vs Q3 2025: up about 24%
-
Typical single-family profile: ~3,700 sq ft, 4.7 bedrooms, 3.6 baths, ~13,100 sq ft lot
Cambridge single-family:
-
~35 sales
-
Average sale price: ~$3.35M
-
Average days to offer: ~30 days
-
Sale-to-list: ~104%
-
Prices vs Q4 2024: up about 31%
-
Prices vs Q3 2025: up about 25%
-
Typical single-family profile: ~2,600 sq ft, 3.8 bedrooms, 3.0 baths, ~4,400 sq ft lot
In Cambridge, the story is: if you blink, you miss it. When a single-family hits the market, serious buyers show up quickly and often bid over asking.
Brookline, by contrast, feels like a prestige art auction:
-
The pool of buyers is smaller, and
-
The ones who do show up expect to negotiate.
Prices are sky-high, but deals take longer to put together.
Newton & Needham: More Sales, More Range
Newton single-family:
-
~134 sales
-
Average sale price: ~$1.91M
-
Average days to offer: ~30 days
-
Sale-to-list: ~99%
-
Prices vs Q4 2024: down about 13%
-
Prices vs Q3 2025: down about 11%
-
Typical single-family profile: ~3,500 sq ft, 4.3 bedrooms, 3.5 baths, ~12,200 sq ft lot
Needham single-family:
-
~49 sales
-
Average sale price: ~$1.84M
-
Average days to offer: ~35 days
-
Sale-to-list: ~100%
-
Prices vs Q4 2024: up about 4–5%
-
Typical single-family profile: ~3,500 sq ft, 4.2 bedrooms, 3.4 baths, ~17,300 sq ft lot
Newton is where we see more activity at mid-to-upper price points:
-
Plenty of sales,
-
Fewer ultra-luxury outliers at the very top,
-
Averages that slide down even though demand is still very real.
Needham, by contrast, is having a quieter run: not flashy, but solidly upward, with prices edging higher and buyers willing to pay for space and schools.
Southwest Boston Locations: Jamaica Plain, Roslindale & West Roxbury
Jamaica Plain
-
~16 single-family sales
-
Average sale price: ~$1.62M
-
Average days to offer: ~25 days
-
Sale-to-list: ~98.5%
-
Prices vs Q4 2024: up about 15–16%
-
Typical single-family profile: ~2,200 sq ft, 3.6 bedrooms, 2.5 baths, ~6,300 sq ft lot
Jamaica Plain remains a “small but mighty” single-family market—limited inventory, strong prices, and buyers who know exactly why they want this location.
Roslindale
-
~19 sales
-
Average sale price: ~$792K
-
Average days to offer: ~57 days
-
Sale-to-list: ~100%
-
Prices vs Q4 2024: down about 10%
-
Typical single-family profile: ~1,700 sq ft, 3.5 bedrooms, 1.9 baths, ~5,400 sq ft lot
Roslindale feels more like a “pause and recalibrate” market:
-
Homes are taking longer to go under agreement,
-
Sellers who adjust pricing still land around asking,
-
Buyers get more time to walk through, compare, and decide.
West Roxbury
-
~54 sales
-
Average sale price: ~$947K
-
Average days to offer: ~23 days
-
Sale-to-list: ~100.5%
-
Prices vs Q4 2024: up about 11%
-
Typical single-family profile: ~1,900 sq ft, 3.5 bedrooms, 2.0 baths, ~6,400 sq ft lot
West Roxbury continues to function as a value-driven single-family hub: more space and yard than many city neighborhoods, at a price that still feels like a rational trade-up.
Inner-Ring Suburbs: Belmont, Watertown, Waltham, Medford, Melrose & Milton
Across these locations, the patterns are similar:
-
Homes often go under agreement within 2–4 weeks
-
Sale-to-list ratios at or above 100%
-
A mix of steady and strong year-over-year price trends
Belmont:
-
~35 sales, ~$1.66M average
-
~30 days to offer
-
Sale-to-list: ~97%
-
Prices vs Q4 2024: down about 18%
-
Typical single-family profile: ~2,700 sq ft, 3.9 bedrooms, 2.8 baths, ~10,900 sq ft lot
Belmont sits at a higher price point where buyers are selective and negotiation is part of the script.
Watertown & Waltham:
-
Watertown single-family:
-
~18 sales, ~$1.00M average
-
~15 days to offer
-
Sale-to-list: ~101%
-
Typical single-family profile: ~2,000 sq ft, 3.4 bedrooms, 2.0 baths, ~6,300 sq ft lot
-
-
Waltham single-family:
-
~54 sales, ~$935K average
-
~19 days to offer
-
Sale-to-list: ~102%
-
Prices vs Q4 2024: up about 8%
-
Typical single-family profile: ~2,100 sq ft, 3.3 bedrooms, 2.1 baths, ~8,500 sq ft lot
-
Both markets are still very much “if it’s nice and priced right, it goes” environments.
Medford & Melrose:
-
Medford single-family:
-
~54 sales, ~$980K average
-
~24 days to offer
-
Sale-to-list: ~102%
-
Prices vs Q4 2024: up around 6%
-
Typical single-family profile: ~1,900 sq ft, 3.4 bedrooms, 2.0 baths, ~6,000 sq ft lot
-
-
Melrose single-family:
-
~40 sales, ~$997K average
-
~16 days to offer
-
Sale-to-list: ~104%
-
Prices vs Q4 2024: up about 9%
-
Typical single-family profile: ~2,100 sq ft, 3.5 bedrooms, 2.0 baths, ~8,200 sq ft lot
-
These are textbook “move fast or miss it” markets for buyers; for sellers, they’re about as friendly as it gets.
Milton:
-
~50 sales, ~$1.31M average
-
~32 days to offer
-
Sale-to-list: ~100%
-
Prices vs Q4 2024: up about 27%
-
Typical single-family profile: ~2,500 sq ft, 3.7 bedrooms, 2.4 baths, ~16,500 sq ft lot
Milton is where a lot of buyers discover that their “someday” yard and square footage can actually be a right now decision.
North Shore Single-Family Snapshot: Lynn, Salem, Swampscott, Marblehead, Peabody & Beverly
Taken together, these Essex County spots had:
-
~307 single-family sales in Q4 2025
-
Average sale price: about $871K
-
Homes going under agreement in about 3–4 weeks
-
Sale prices around or slightly above asking
By location:
Beverly:
-
~65 sales, ~$888K average
-
~16 days to offer
-
Sale-to-list: ~102%
-
Prices vs Q4 2024: up about 11%
-
Typical single-family profile: ~2,000 sq ft, 3.4 bedrooms, 2.0 baths, ~20,000 sq ft lot
One of the clearest strength stories on the North Shore: demand, speed, and pricing are all aligned.
Lynn:
-
~91 sales, ~$593K average
-
~22 days to offer
-
Sale-to-list: ~100%
-
Prices vs Q4 2024: down about 3%
-
Typical single-family profile: ~1,600 sq ft, 3.2 bedrooms, 1.7 baths, ~6,200 sq ft lot
Lynn remains a more affordable entry point with real activity. When sellers price realistically, buyers respond quickly. Never sleep on Lynn, especially the Sinners!
Peabody & Salem:
-
Peabody single-family:
-
~57 sales, ~$707K average
-
~22 days to offer
-
Prices up around 3–4% vs Q4 2024
-
Typical single-family profile: ~1,900 sq ft, 3.4 bedrooms, 1.9 baths, ~11,900 sq ft lot
-
-
Salem single-family:
-
~37 sales, ~$729K average
-
~29 days to offer
-
Prices down about 6% vs Q4 2024
-
Typical single-family profile: ~1,900 sq ft, 3.3 bedrooms, 1.9 baths, ~7,400 sq ft lot
-
Together, they show a mixed but active picture: Peabody pushing higher, Salem softening a bit but still moving.
Marblehead & Swampscott:
-
Marblehead single-family:
-
~37 sales, ~$1.37M average
-
~29 days to offer
-
Prices down about 11% vs Q4 2024
-
Still selling slightly over asking on average
-
Typical single-family profile: ~2,400 sq ft, 3.5 bedrooms, 2.5 baths, ~9,600 sq ft lot
-
-
Swampscott single-family:
-
~20 sales, ~$935K average
-
~30 days to offer
-
Prices down about 19% vs Q4 2024
-
Sale-to-list just over 100%
-
Typical single-family profile: ~2,400 sq ft, 3.6 bedrooms, 2.5 baths, ~9,700 sq ft lot
-
These are classic examples of locations where the emotional pull is strong—but the market is renegotiating exactly whether Sentimental Value*** translates into in today’s dollars.
What Does This Suggest for Q1 2026?
We don’t have Q1 2026 data yet, but we do know what happened last year in these same counties:
-
From Q4 2024 to Q1 2025:
-
Single-family sales dropped by about 42%,
-
Average prices dipped by about 3% overall.
-
Q1 often looks, at first glance, like "It was Just and Accident"—sales fall sharply from Q4—but that’s really just seasonality.
If Q1 2026 rhymes with that pattern:
-
Buyers can expect:
-
Fewer new listings than in Q4 or spring
-
Less competition than peak season, but still firm pricing in the best locations
-
The most interesting opportunities in areas showing flat or softer year-over-year prices (Roslindale, parts of Lynn/Salem, segments of Newton, Swampscott/Marblehead)
-
-
Sellers can expect:
-
Less competition from other listings in Q1
-
Strong outcomes if the home is well-prepped and priced in line with the data
-
Especially good leverage in locations with over-asking averages and brisk days on market (Cambridge, Melrose, Beverly, Waltham, Watertown/Medford, parts of Milton and West Roxbury)
-
Bottom line:
The single-family market across these Greater Boston counties is tight, expensive, and highly location-specific. Q4 2025 was not a meltdown; it was an adjustment.
Want to Know What These Numbers Mean for Your Home?
All of this is helpful at the big-picture level, but your situation is never just statistics:
-
Your exact location and property type
-
Your timeline (Are you thinking about a 2026 move? Sooner? Later?)
-
Whether you’re moving up, moving down, or changing counties altogether
If you’re even casually thinking about a move in 2026, the smartest first step is:
We’ll walk through:
-
How Q4 2025 impacted your likely current value
-
How your specific location is trending heading into Q1 2026
-
What a realistic, numbers-backed plan looks like if you’d like to make a move this year
That way, you’re not left guessing which opportunities hold real Sentimental Value and which are just noise—you’re making decisions with a clear, grounded view of the market.
**All market data in this report is sourced from MLS PIN and is based on information provided by listing agents and brokerages. While deemed reliable, it is not guaranteed and may be subject to errors, omissions, or revisions.
*** A brief apology for the unsolicited movie references. You could qualify the Boston Home Team as a movie loving group of realtors. And being award season, I wanted to throw a few nods to my favorites of 2025.