Big picture – Single-family vs last month & last year
-
Activity was solid, not crazy.
High-volume SF markets in November were:-
Newton (45 sales)
-
Lynn (33)
-
Quincy (33)
-
Beverly (21)
-
Peabody (19)
-
Lexington (19)
-
Plus a strong cluster in Needham, Malden, Saugus, Arlington, Dedham, Waltham, Milton, Salem, West Roxbury (11–18 sales each).
-
-
Prices are holding or drifting up per square foot, even where average sale prices look softer:
-
Many towns show YoY price-per-sqft increases (Belmont, Concord, Lexington, Newton, Lynn, Needham, Wellesley, etc.).
-
But average prices are often down vs last year in higher-end towns, suggesting smaller / more modest homes in the mix, not a collapse in values.
-
-
Competition is lower than peak-pandemic but still real.
In most reliable markets, sale-to-list ratios run around 99–102%, i.e. very close to asking, but the big over-ask blowouts (105%+) are rarer. -
Days to offer have lengthened almost everywhere vs last November:
-
Many towns are now in the 15–35 day range instead of low-teens or single digits.
-
That’s still a seller-friendly market, just not a frenzy.
-
(Note: wherever November had fewer than 8 sales, I treat the numbers as “thin data” and avoid strong claims.)
High-activity single-family markets to watch
Newton – still the workhorse
-
45 sales in Nov (down slightly vs Oct’s 49, but up vs 37 a year ago).
-
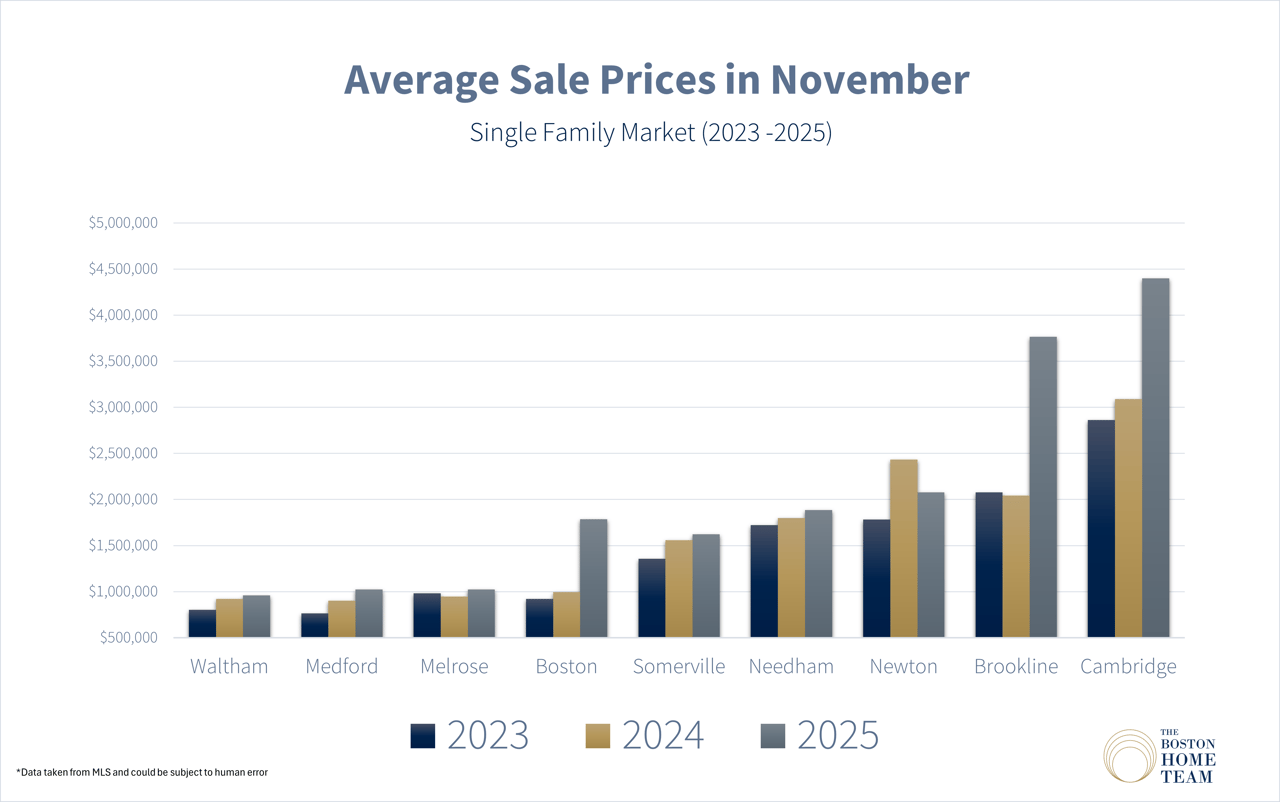
Average price: ≈ $2.08M
-
Up ~20% vs Oct, but down ~15% vs last November (heavier mix of ultra-high-end closings last year).
-
-
Price per sq ft: ≈ $623, up vs both Oct and last year.
-
Days to offer: ~30 days, slower than last year (26 days).
-
Sale/list: ~97.8%, down from 101%+ last year.
Story: Newton SF is busy and expensive, with buyers taking more time and less willing to bid way over asking, but still paying more per foot than a year ago.
Lexington, Wellesley, Needham – high-end suburbs
Lexington (19 sales, solid sample)
-
Avg price ≈ $2.37M, up ~18% MoM and ~32% YoY.
-
PPSF ≈ $550, essentially flat YoY.
-
DOM up into the high-30s (was mid-20s last year).
-
Sale/list about 101% (still over-ask, but less wild than during 2022–23).
Wellesley (18 sales)
-
Avg price ≈ $2.33M, down modestly vs Oct and vs last year.
-
PPSF ≈ $690, up vs both periods – again, mix vs value.
-
DOM around 24–25 days, similar to last year.
-
Sale/list hugging 100%.
Needham (16 sales)
-
Avg price ≈ $1.89M, up mid-single digits vs both Oct and last year.
-
PPSF (~$561) is up strongly vs Oct and slightly vs last year.
-
DOM has stretched to about 32 days (vs ~18 a year ago).
-
Sale/list still around 101%.
Takeaway: the Route 128 luxury belt is price-resilient (especially per square foot) but clearly less frantic: homes are sitting longer and buyers have marginally more leverage.
North Shore & near-North – busy and more price-sensitive
Lynn (33 sales)
-
Strong activity: 33 sales vs 27 last year.
-
Avg price ~$612K (down ~5% YoY), but PPSF (~$420) is up ~12% YoY.
-
DOM ~20 days, double last year’s pace, and sale/list (~101%) has come down from 105%+.
Beverly (21 sales)
-
Avg price ≈ $979K, up ~13% vs Oct and ~23% vs last year.
-
PPSF is down vs Oct and a bit under last year – again pointing to bigger houses in the mix.
-
DOM around 17 days, very quick.
-
Sale/list a touch over 101%.
Peabody (19 sales)
-
Avg price ≈ $716K, essentially flat vs Oct and up ~7% YoY.
-
PPSF (~$375) is down vs last year, implying more space per dollar.
-
DOM in the high-teens, with sale/list just above 101%.
Salem (12 sales)
-
Avg price ~$761K (flat vs last year).
-
PPSF (~$423) up ~7% YoY.
-
DOM is longish at ~38–39 days, and sale/list around 101%.
Saugus (15 sales)
-
Avg price ~$686K, down vs Oct but up vs last year.
-
PPSF mid-$380s, a bit above last year.
-
DOM just under 20 days, sale/list ≈ 101.5%.
Takeaway: the North Shore SF market is active and generally competitive, but with slower absorption and more nuanced pricing: some buyers are getting more house for the money even as $/sqft remains firm or drifts up.
Inner-ring, mid-price suburbs
Arlington (20 sales)
-
Avg price ≈ $1.35M, up ~7% MoM and ~3–4% YoY.
-
PPSF (~$573) is down vs both Oct and last year, suggesting larger or less-renovated homes trading.
-
DOM jumped to ~36 days (was ~21 in Oct and ~10 a year ago).
-
Sale/list slipped from huge over-ask (107% last year) to essentially at asking (~100%).
Medford (11 sales)
-
Avg price ≈ $1.02M, up vs both Oct and last year.
-
PPSF (~$505) slightly down vs last year.
-
DOM ~14 days, much quicker than Oct’s almost-month-long average.
-
Sale/list about 100%.
Malden (15 sales)
-
Avg price ≈ $749K, up vs both Oct and last year.
-
PPSF (~$465) flat YoY.
-
DOM ~17 days, similar to last year.
-
Sale/list robust at ~104%.
Dedham (16 sales)
-
Avg price ≈ $893K, down vs both Oct and last year.
-
PPSF has eased, DOM has stretched into the mid-40s, and sale/list has drifted just under 100%.
Waltham (14 sales)
-
Avg price ≈ $958K, up modestly vs Oct and last year.
-
PPSF (~$453) has softened vs last year.
-
DOM in the high-teens, sale/list around 102%.
Takeaway: inner-ring SF markets are still very saleable, but:
-
Over-ask bidding is more selective, and
-
Days to offer are up compared with last November, especially in places like Arlington and Dedham.
Boston single-family neighborhoods (directional read)
Only a few Boston neighborhoods had enough SF sales in November to treat as reliable:
-
Dorchester (12 sales) – Avg ≈ $905K; PPSF has dropped vs last year, but prices are up ~25% YoY and DOM is now around 2 weeks. Sale/list around 98.5%, down from over-ask levels last year.
-
Jamaica Plain (9 sales) – Avg ≈ $1.67M, up ~21% YoY, with PPSF in the low-$600s and DOM in the mid-teens. Sale/list just under 98%.
-
Lynn-like outer Boston markets: Hyde Park, Mattapan, Roslindale, West Roxbury, Eastie, Charlestown, etc.
Most of these had fewer than 8 sales each, so month-to-month swings are mostly about which houses sold, not fundamental shifts.
Big picture in Boston SF:
Single-family homes in city neighborhoods are highly segmented and often driven by just a handful of trades. Where volume is decent (Dorchester, JP, West Roxbury), you see higher prices than last year but much tamer bidding.
Quick SF vs condo snapshots (same towns)
A few useful talking points where you have both product types:
-
Newton:
-
SF: 45 sales, ≈ $2.08M, ~$623/sqft, 30 days, 97.8% of list.
-
Condo: 27 sales, ≈ $1.08M, ~$590/sqft, 44 days, ~99% of list.
👉 SF is much more expensive and sells faster, but condos are currently closer to asking on average.
-
-
Cambridge: (thin SF sample – 7 sales)
-
SF: ≈ $4.4M, ~$1,083/sqft, 12 days, ~104% of list.
-
Condo: ≈ $1.38M, ~$1,013/sqft, 38 days, ~99% of list.
👉 The SF segment is a tiny, ultra-luxury niche that still behaves like a bidding-war market.
-
-
Somerville: (SF thin – 5 sales)
-
SF: ≈ $1.62M, ~$734/sqft, ~12 days, ~102% of list.
-
Condo: ≈ $929K, ~$746/sqft, ~21 days, ~100% of list.
👉 Condos dominate volume; SF is a low-inventory, high-price add-on.
-
-
Quincy:
-
SF: 33 sales, ≈ $876K, ~$456/sqft, 25 days, ~100% of list.
-
Condo: 21 sales, ≈ $574K, ~$488/sqft, 26 days, ~99% of list.
👉 SF and condos move at similar speeds, but condos get a slight $/sqft premium; SF is the bigger ticket.
-
-
Salem:
-
SF: 12 sales, ≈ $761K, ~$423/sqft, 39 days, ~101% of list.
-
Condo: 21 sales, ≈ $578K, ~$439/sqft, 38 days, ~97% of list.
👉 SF buyers in Salem are still bidding over ask, while condo buyers have a bit more negotiating room.
-