Greater Boston Condominium Market Update | Q4 2025
From JP to Somerville, Milton to Malden, Lynn to Quincy, here’s how Q4 2025 condo prices, sales, and days on market stacked up so you can plan your 2026 move with clear eyes.
Key takeaway: Across Greater Boston, condo prices mostly held steady or edged up, even as days to offer stretched longer and sales volumes softened in many core areas. Buyers have a bit more breathing room, but this is not a “fire sale” market.
Quick Snapshot: Q4 2025 by County (Condos, All Locations)
All stats below are for condominiums only across Essex, Middlesex, Norfolk, and Suffolk counties.
Across the four-county Greater Boston region in Q4 2025:
-
2,834 condo sales
-
Average sale price: about $783,000
-
Average time to offer: ~36 days
-
Average sale-to-list ratio: roughly 99% of asking
So overall, condo sellers are still achieving very close to list price, but it’s taking longer to get there compared to last year.
Essex County Condos
-
Q4 2025 sales: 532 condos
-
Average sale price: $537,557
-
Average days to offer: 32 days
-
Sale-to-list ratio: ~99–100% of asking
Directionally:
-
# of Sales: up about 14% vs Q3 and roughly flat vs Q4 2024
-
Prices: basically flat vs Q3 and up slightly (~2%) vs last year
-
Days on market: noticeably longer than both Q3 and last year
👉 Essex County’s condo market stayed price-stable with more breathing room for buyers in terms of time, but not big discounts.
Middlesex County Condos
-
Q4 2025 sales: 1,064 condos
-
Average sale price: $743,969
-
Average days to offer: 31 days
-
Sale-to-list ratio: about 100% of asking
Directionally:
-
Sales: down slightly (~5%) vs Q3 and down a bit vs Q4 2024
-
Prices: flat vs Q3 and up low single-digits (~3%) vs last year
-
Days on market: longer than both Q3 and Q4 2024
👉 Middlesex remains a high-demand condo corridor (think Cambridge, Somerville, Arlington, Medford), with very little price erosion and, just as in Essex, a bit more time for buyers to think before writing.
Norfolk County Condos
-
Q4 2025 sales: 441 condos
-
Average sale price: $718,713
-
Average days to offer: 32 days
-
Sale-to-list ratio: about 99–100%
Directionally:
-
Sales: essentially flat vs Q3 and slightly down vs last year
-
Prices: down modestly (~2%) vs Q3 and slightly lower vs Q4 2024
-
Days on market: a bit longer than either Q3 2025 or Q4 2024.
👉 Norfolk County condo markets (including Quincy, Milton, Dedham, Needham) are steady but not surging: buyers can negotiate around the edges, but well-priced units are still selling close to asking.
Suffolk County Condos
-
Q4 2025 sales: 797 condos
-
Average sale price: $1,035,991
-
Average days to offer: 46 days
-
Sale-to-list ratio: around 98% of asking
Directionally:
-
Sales: down sharply (~24%) vs Q3 and down ~4% vs Q4 2024
-
Prices: up ~5% vs Q3, but slightly lower (~2%) vs last year
-
Days on market: meaningfully longer than both Q3 and 2024
👉 In Suffolk (Boston, Revere, East Boston, etc.), fewer condos sold, but sellers who adjusted to the market still got their list price. It’s a slower, but not a distressed market. Things will sell if the sellers aren't asking too much.
Core Condo Hubs: Cambridge, Somerville, Brookline & Brighton
These are the “headline” condo markets many buyers and sellers watch first.
Cambridge
-
Q4 2025 sales: 120 condos
-
Average sale price: $1,181,658
-
Average days to offer: 35 days
-
Sale-to-list ratio: ~99.6%
Price direction:
-
Slightly higher vs Q3 (up ~3%)
-
Up solidly vs Q4 2024 (about 8%)
“Typical” Cambridge condo (2021–2025 averages):
-
~1,220 sq ft, 2.1 beds, 1.8 baths
👉 Cambridge remains a premium, resilient condo market. Prices pushed higher year-over-year, and even with roughly five weeks to find a buyer, sellers are still getting just about list price.
Somerville
-
Q4 2025 sales: 88 condos
-
Average sale price: $906,286
-
Average days to offer: 28 days
-
Sale-to-list ratio: ~99.4%
Price direction:
-
Flat vs Q3
-
Modestly lower (~5%) vs Q4 2024
“Typical” Somerville condo:
-
~1,360 sq ft, 2.3 beds, 1.9 baths
👉 Somerville condo prices have leveled off, giving buyers slightly more leverage than in 2024, but inventory is still competitive and properties move in under 30 days.
Brookline
-
Q4 2025 sales: 86 condos
-
Average sale price: $1,176,419
-
Average days to offer: 36 days
-
Sale-to-list ratio: ~99.5%
Price direction:
-
Essentially flat vs both Q3 and Q4 2024
“Typical” Brookline condo:
-
~1,440 sq ft, 2.3 beds, 1.8 baths
👉 Brookline’s condo market is stable and high-priced. It’s still a strong seller’s market, but buyers know what to expect and are paying close to full price for well-located units.
Brighton
-
Q4 2025 sales: 42 condos
-
Average sale price: $605,367
-
Average days to offer: 46 days
-
Sale-to-list ratio: ~98.9%
Price direction:
-
Down vs Q3
-
Roughly flat vs Q4 2024
“Typical” Brighton condo:
-
~880 sq ft, 1.7 beds, 1.3 baths
👉 Brighton continues to be a more affordable entry point into the Boston condo market. Prices are holding year-over-year, but the longer time to offer and softer quarter-over-quarter trend give buyers more negotiating room than in Cambridge or Brookline.
City-Adjacent & Inner-Ring Condos
JP to Malden, Newton to Quincy
These are the close-in neighborhoods and suburbs many 2026 movers are considering as alternatives to the downtown core.
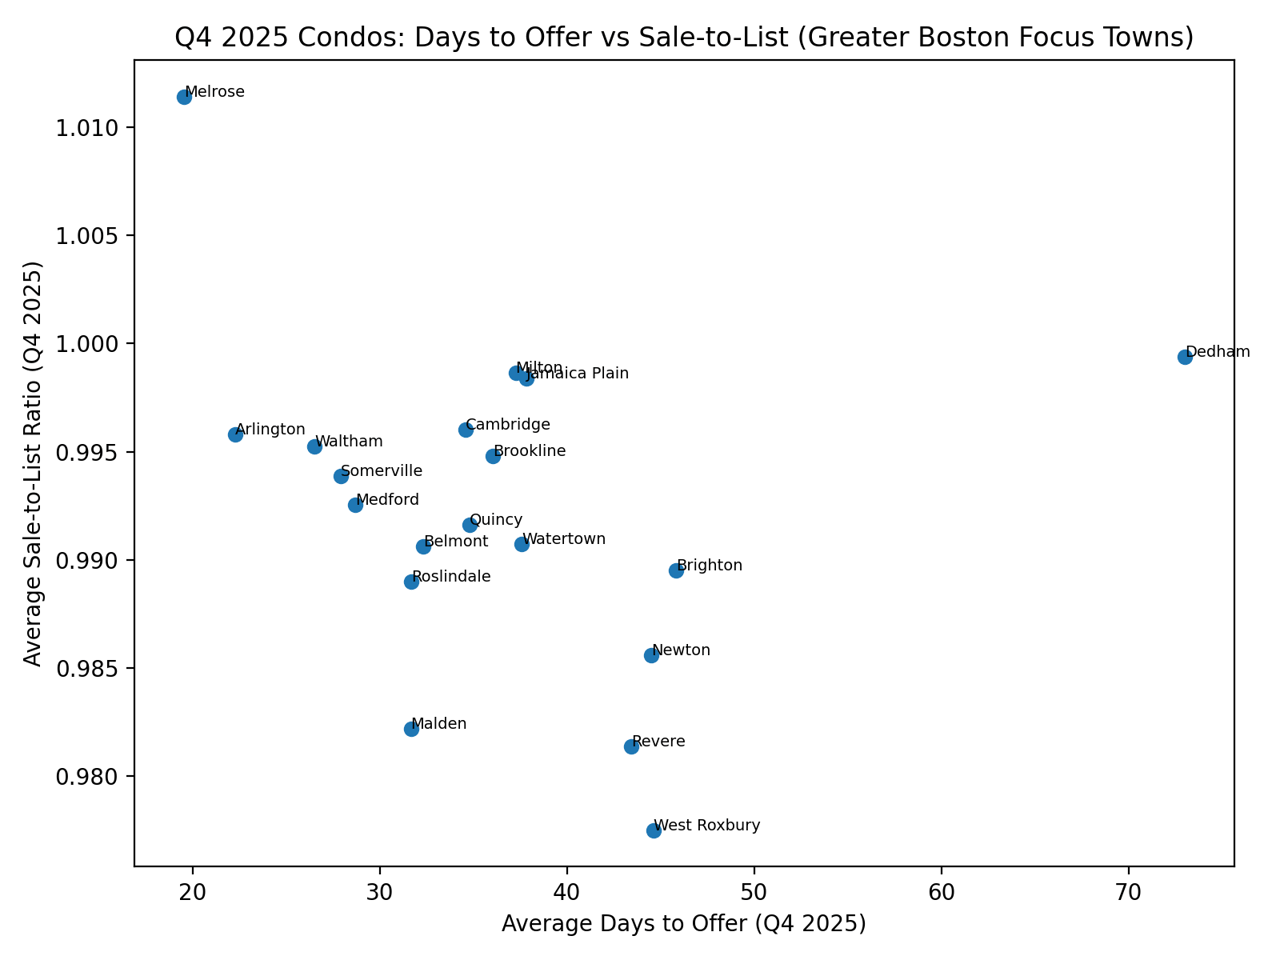
Jamaica Plain, Roslindale & West Roxbury
Jamaica Plain
-
Q4 2025 sales: 62
-
Average price: $789,393
-
Days to offer: 38
-
Sale-to-list: ~99.8%
-
Prices were down vs Q3 and slightly lower vs last year
“Typical” JP condo: ~1,220 sq ft, 2.3 beds, 1.6 baths
Roslindale
-
31 sales, average around $600,900, ~32 days to offer
-
Sale-to-list ~98.9%, slightly lower prices vs last year
West Roxbury
-
18 sales (still ≥10, but a smaller sample)
-
Average price ~$533,600, ~45 days to offer
-
Sale-to-list ~97.7%, with prices down vs last year
👉 In these Boston neighborhoods, buyers have more time and a bit more room to negotiate, especially in West Roxbury, but well-presented condos are still moving at or near asking. JP, among them, is definitely the strongest of the 3 markets.
Newton, Watertown & Waltham
Newton
-
Q4 2025 sales: 77
-
Average price: $1,166,075
-
Days to offer: 45
-
Sale-to-list: ~98.6%
-
Prices are flat vs Q3 and modestly lower vs last year
“Typical” Newton condo: ~2,070 sq ft, 2.8 beds, 2.5 baths
Watertown
-
44 sales, average around $766,786
-
38 days to offer, sale-to-list ~99.1%
-
Prices are down vs Q3 but roughly flat year-over-year
Waltham
-
45 sales, average roughly $646,106
-
27 days to offer, sale-to-list ~99.5%
-
Prices are down both quarter-over-quarter and year-over-year
👉 Newton remains a high-price, slower-moving condo market. Watertown and Waltham are more mid-priced with strong demand—especially Waltham, where time-to-offer is under a month, despite some price softening.
Arlington, Medford, Malden & Quincy
Arlington
-
Q4 2025 sales: 46
-
Average price: $896,965
-
Days to offer: 22
-
Sale-to-list: ~99.6%
-
Prices are up vs both Q3 and Q4 2024
“Typical” Arlington condo: ~1,510 sq ft, 2.6 beds, 1.9 baths
Medford
-
38 sales, average around $677,242
-
29 days to offer, sale-to-list ~99.3%
-
Prices are slightly lower vs Q3 and down vs last year
Malden
-
15 sales
-
Average price ~$431,893, 32 days to offer
-
Sale-to-list ~98.2%, with prices down vs both Q3 and 2024
Quincy
-
73 sales
-
Average price: $528,434
-
Days to offer: 35
-
Sale-to-list: ~99.2%
-
Prices are flat vs Q3 and flat vs Q4 2024
“Typical” Quincy condo: ~1,150 sq ft, 1.9 beds, 1.7 baths
👉 From Arlington and Medford to Malden and Quincy, buyers see a range of price points, but a common pattern: well-priced condos still sell quickly and near asking, with the most intense competition in Arlington and steady, budget-friendlier options in Malden and Quincy.
Revere, Melrose, Milton, Dedham & Needham
Revere
-
Q4 2025 sales: 57
-
Average price: $448,968
-
Days to offer: 43
-
Sale-to-list: ~98.1%
-
Prices were slightly higher vs Q3 but lower vs last year
“Typical” Revere condo: ~1,140 sq ft, 1.9 beds, 1.6 baths
Melrose
-
16 sales, average around $528,634
-
20 days to offer, sale-to-list ~101.1%
-
Prices are slightly higher year-over-year
Milton
-
19 sales, average about $925,494
-
37 days to offer, sale-to-list ~99.9%
-
Prices are up vs Q3 but lower vs last year
Dedham
-
10 sales
-
Average price ~$908,937, 73 days to offer
-
Sale-to-list ~99.9%, with prices higher vs last year but a much slower pace
Needham
-
6 condo sales in Q4 2025
-
This is below our 10-sale reliability threshold, so the sample is too small to lean on for strong pricing conclusions.
👉 In these city-adjacent and close-in suburbs, you see a mix of fast-moving, slightly underpriced pockets (Melrose) and higher-end, slower segments (Milton, Dedham). Revere offers coastal access at a lower price point, with buyers able to negotiate a bit more than in Cambridge or Arlington.
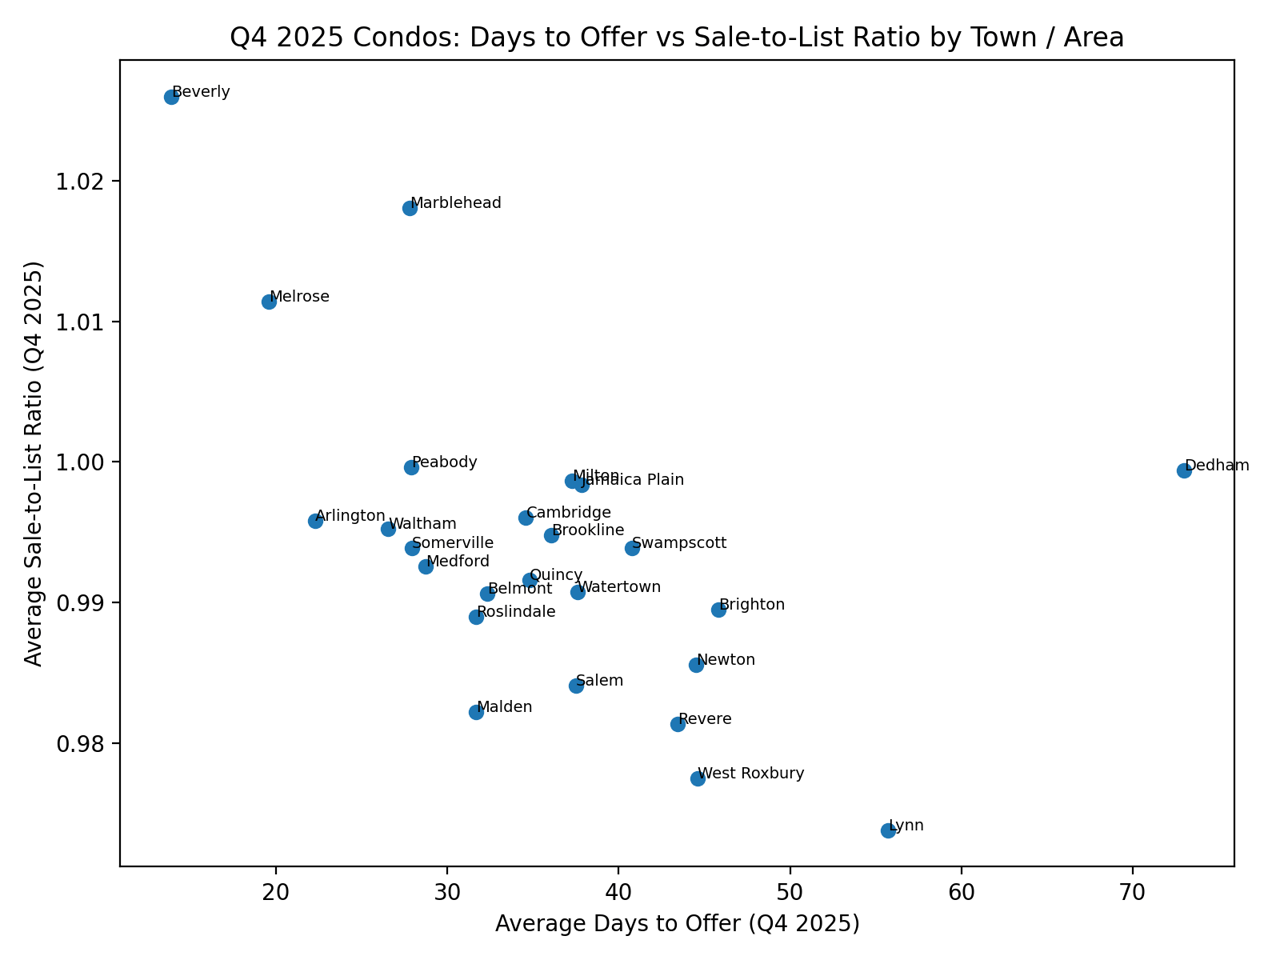
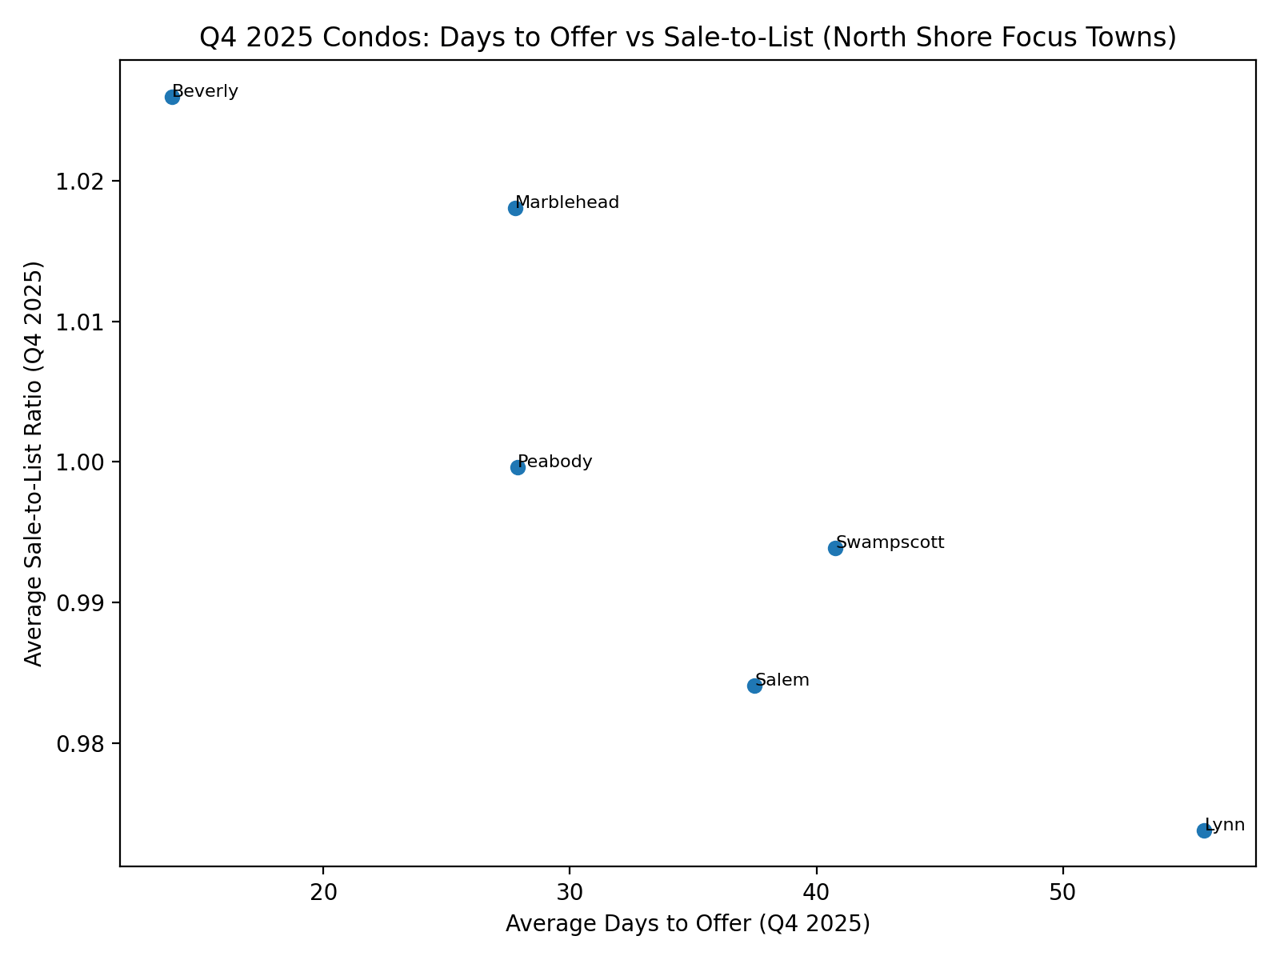
North Shore Condos: Beverly, Salem, Peabody, Marblehead, Lynn & Swampscott
Salem, Peabody & Beverly
Salem
-
Q4 2025 sales: 66
-
Average price: $571,583
-
Days to offer: 37
-
Sale-to-list: ~98.4%
-
Prices were slightly higher vs Q3 and up ~10% vs Q4 2024
“Typical” Salem condo: ~1,290 sq ft, 2.2 beds, 1.7 baths
Peabody
-
23 sales, average about $528,804
-
28 days to offer, sale-to-list ~100%
-
Prices moved meaningfully higher vs both Q3 and last year
Beverly
-
14 sales
-
Average price ~$552,392, 14 days to offer
-
Sale-to-list ~102.6%
-
Prices are up quarter-over-quarter and year-over-year
👉 These three North Shore markets are quietly strong for condo sellers: prices have pushed higher, especially in Peabody and Beverly, and the best listings are still selling fast and, in Beverly’s case, often over asking. Salem is still the keystone market for this part of the North Shore.
Lynn, Marblehead & Swampscott
Lynn
-
Q4 2025 sales: 36
-
Average price: $357,679
-
Days to offer: 56
-
Sale-to-list: ~97.4%
-
Prices are down vs Q3 and slightly lower vs last year
“Typical” Lynn condo: ~1,050 sq ft, 1.9 beds, 1.4 baths
Marblehead
-
18 sales, average around $555,833
-
28 days to offer, sale-to-list ~101.8%
-
Prices are down vs both Q3 and Q4 2024
Swampscott
-
13 sales (smaller but still ≥10)
-
Average price ~$456,392, 41 days to offer
-
Sale-to-list ~99.4%
-
Prices are significantly lower vs Q3 (likely influenced by a few high-end Q3 sales) but slightly higher vs last year
👉 On this stretch of the coast from Lynn to Swampscott and Marblehead, you’ll find a wide pricing spread. Lynn offers the most affordable condos but with slower absorption and some price softness, while Marblehead and Swampscott lean more “destination coastal”—still selling near asking, but with more volatility quarter-to-quarter due to smaller sample sizes. They are much smaller condo markets in general.
What Q4 2025 Might Mean for Q1 2026 (Condos)
To get a feel for what early 2026 might look like, it helps to look at how the market behaved last year moving from Q4 2024 into Q1 2025:
Across the four counties:
-
Condo sales dropped about 26% from Q4 2024 to Q1 2025
-
At the same time, average prices actually rose about 7% for the region
-
By county, Q1 2025 condo sales were down ~21–34% vs Q4 2024, while prices were:
-
Up in Essex and Middlesex
-
Down modestly in Norfolk
-
Up strongly in Suffolk (high-teens percentage range)
-
In other words, the market already showed us a pattern:
When activity slows seasonally from Q4 to Q1, sales volume takes the hit, not necessarily prices.
What that suggests for Q1 2026 (without “predicting” exact numbers)
Using last year’s pattern as a guide—not a forecast:
-
It’s reasonable to expect fewer condo listings and sales in Q1 2026 compared to Q4 2025
-
Well-priced condos in strong locations (Cambridge, Arlington, parts of Salem/Beverly, etc.) are likely to hold value, even if they take a bit longer to go under contract
-
Buyers may see more choice and slightly less competition, but not a steep discount environment
-
Sellers who price too far above current comps are the ones most likely to sit and chase the market down
If you’re planning a 2026 move, it’s less about “timing the bottom” and more about aligning price, condition, and strategy with the reality of your specific sub-market.
Thinking About Buying a Condo in 2026? Let’s Map Out a Strategy
If you’re considering buying a condo anywhere from JP to Somerville, Milton to Malden, or Lynn to Quincy in 2026, this is a good time to get organized.
A dedicated buyer agency relationship can help you:
-
Clarify your true budget and target neighborhoods based on where condo prices actually landed in Q4 2025
-
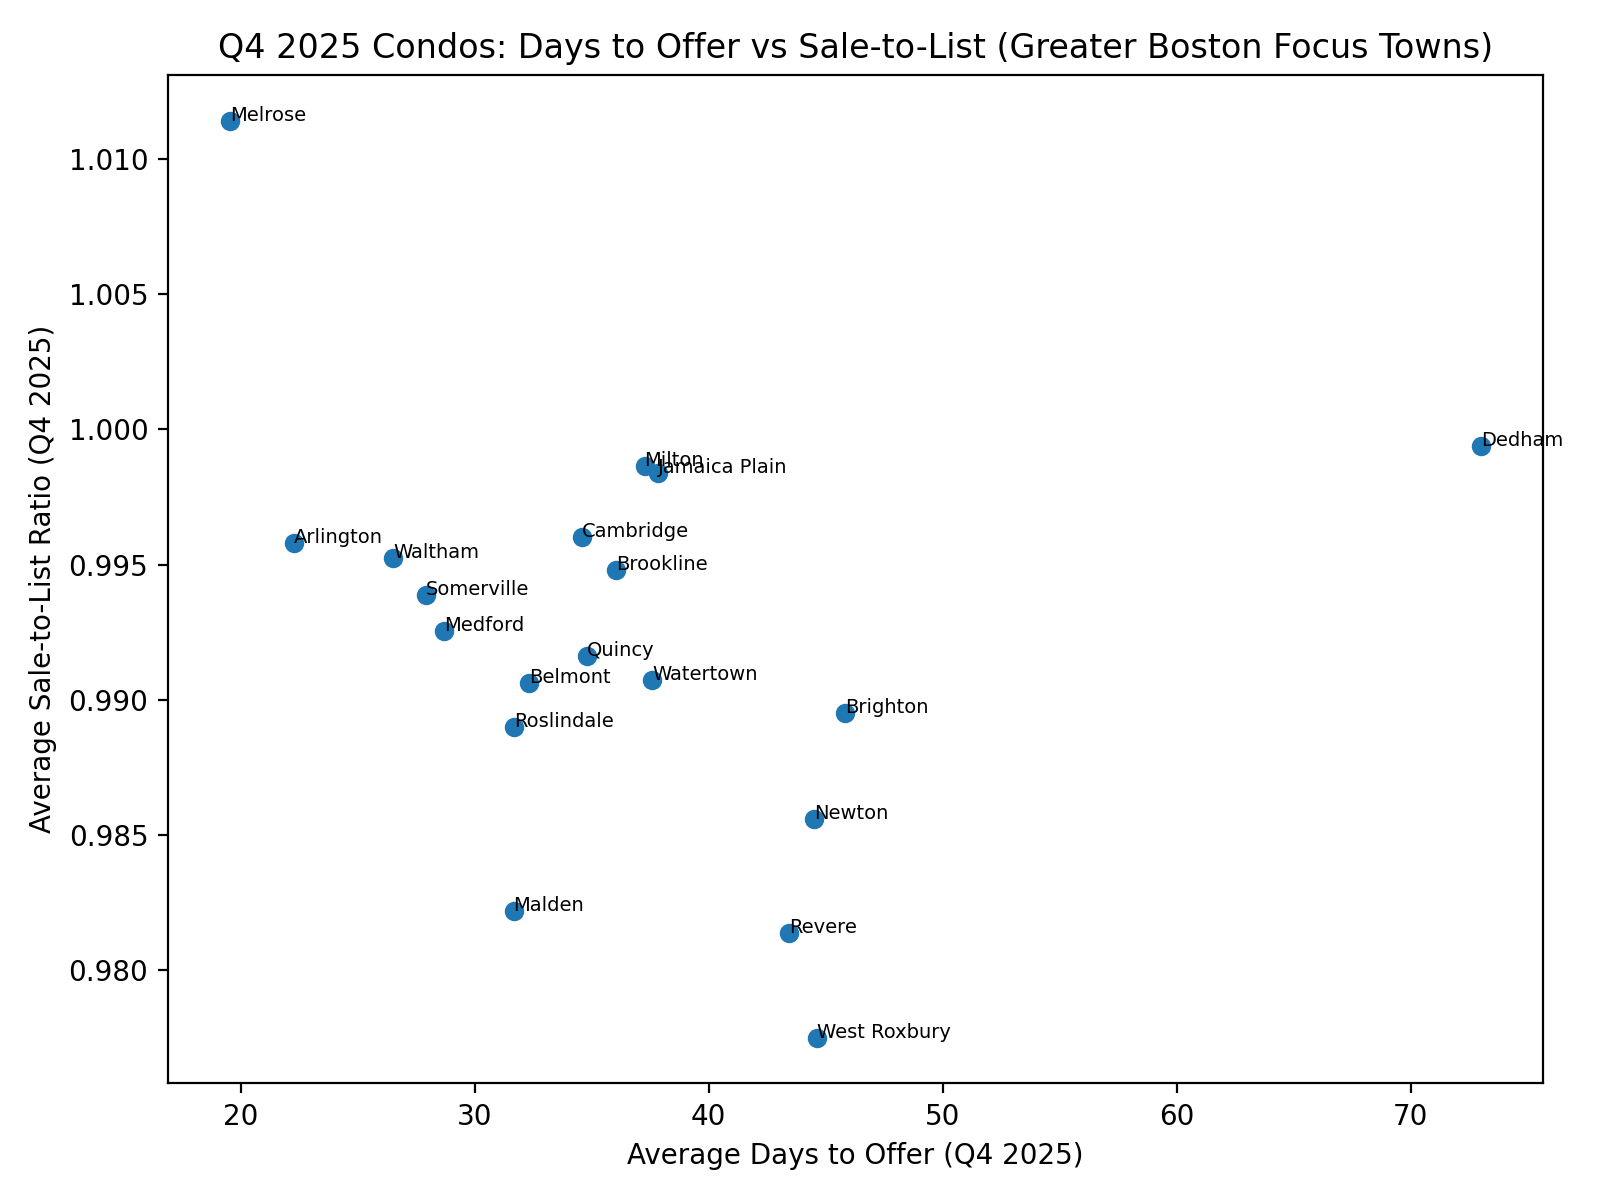
Understand the pace and competition level in your specific areas of interest (for example, 22 days in Arlington vs 46 days in Brighton is a very different buyer experience)
-
Spot value pockets where prices have softened but fundamentals are still strong
-
Negotiate confidently, knowing what “fair” looks like for today’s market, not last year’s headlines
If you’d like help finding the right condo and building a realistic 2026 game plan, reach out and let’s talk through your timing, neighborhoods, and must-haves. We’ll walk you through the numbers and what they mean for your search.
Data Disclaimer
All market data in this report is sourced from MLS PIN and is based on information provided by listing agents and brokerages. While deemed reliable, it is not guaranteed and may be subject to errors, omissions, or revisions. All figures reflect condominium properties only for the time periods and locations indicated.