Big-picture condo story – November 2025
-
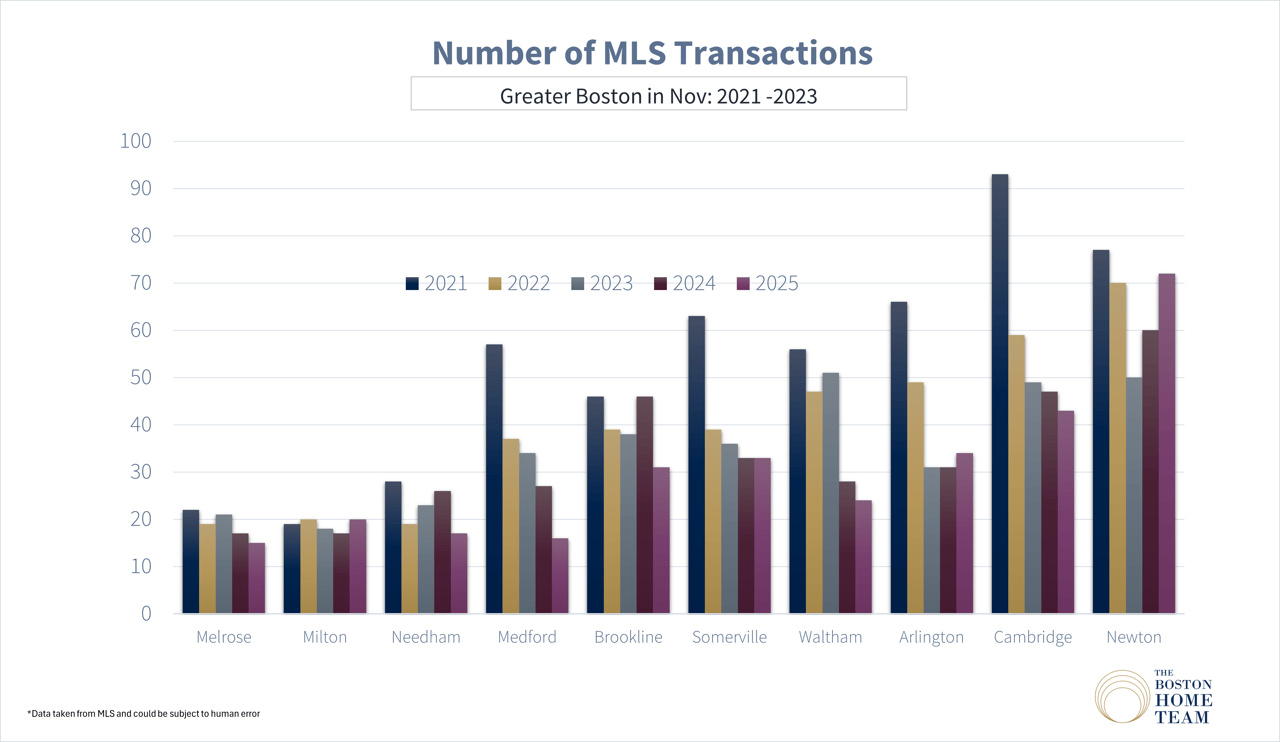
Sales volume cooled from October in many areas, but core urban markets stayed busy. Cambridge (36 closings), South End (29), Somerville (28), Newton (27), Brookline (24) and a cluster at 21 (Quincy, South Boston, Salem, Jamaica Plain) led the region for condo activity.
-
Pricing is holding up or rising in many close-in markets despite fewer sales. Cambridge, Brookline, South End, and several North Shore communities are all showing double-digit year-over-year price or price-per-sqft gains.
-
Days to offer are stretching in several submarkets, especially some North Shore and outer neighborhoods, but sale-to-list ratios mostly sit between 97–101%, so buyers have a bit more leverage but true “discounts” are still rare.
-
Segments with fewer than ~8 sales (for example Bay Village, Needham, Swampscott, Leather District) had very thin data in November, so the month-to-month swings there shouldn’t be treated as solid trends.
Core urban hubs – still the engine of the condo market
Cambridge, Somerville, Brookline, Newton
Cambridge (36 sales, reliable sample)
-
Volume dipped vs October (down ~16%) and is roughly flat vs last year, but pricing surged.
-
Average sale price climbed to about $1.38M, up roughly 25% month-over-month and 21% year-over-year.
-
Price per square foot jumped to about $1,013, up low-teens both MoM and YoY.
-
Homes took around 38 days to get an accepted offer – slower than October and last year – and sale-to-list was still just under 99.5%, very close to asking.
Takeaway: buyers are taking a bit longer to decide, but when they do, they are still paying more per foot than a year ago.
Somerville (28 sales, reliable)
-
Sales eased from October (down ~18%) but are still up almost 8% vs last year.
-
Average sale price (~$929K) is slightly lower than both October and last November, but price per sqft (~$746) is basically flat vs last year.
-
Days to offer are very quick at just over 20 days, dramatically faster than last year’s much slower pace.
-
Sale-to-list ratio is right around 99.9%.
Takeaway: Somerville is a fast, tight market with strong demand; pricing has flattened out more than fallen.
Brookline (24 sales, reliable)
-
Sales dropped sharply from October (down almost 40%), but pricing is strong:
-
Average price (~$1.23M) is up ~13% MoM and ~16% YoY.
-
Price per sqft (~$833) is up mid-single to high-single digits MoM and YoY.
-
-
Days to offer improved to about 20.5 days (faster than October and last year).
-
Sale-to-list at just over 100%, indicating continued competition.
Takeaway: fewer deals, but the ones that are happening are high-quality, well-priced units selling quickly and often at or above asking.
Newton (27 sales, reliable)
-
Volume is down vs October but up ~17% vs last year, so more condos changed hands year-over-year.
-
Average price (~$1.08M) is down roughly 8% from October and about 18% vs last year, but:
-
Price per sqft (~$590) is higher than last year (up around 5%), even though it pulled back from October.
-
-
Days to offer sit in the mid-40s, similar to last year.
-
Sale-to-list is just under 99%.
Takeaway: Newton’s condo market is active but more mix-driven this year – smaller or more modest units are bringing the average price down even though price per foot has edged higher.
Boston neighborhoods: mixed but mostly resilient
Strong momentum: South End, South Boston, JP, East Boston, Brighton
South End (29 sales, reliable)
-
One of the strongest stories this month:
-
Sales surged ~80% vs October and are modestly higher than last year.
-
Average condo price jumped to about $1.56M, up roughly 16% MoM and 19% YoY.
-
Price per sqft (~$1,246) is up low double-digits vs both October and last November.
-
-
Days to offer around 36–37 days, a bit slower than last year but still reasonable for this price point.
-
Sale-to-list ratio is just over 100%, above last year.
Takeaway: high-end condo demand in the South End is very healthy, with more closings and firmer pricing.
South Boston (21 sales, reliable)
-
Sales rose ~31% vs October but are still down vs last November.
-
Average price (~$832K) is down around 11% MoM and 11% YoY, yet:
-
Price per sqft (~$846) is up strongly – low double-digits vs both October and last year.
-
-
Days to offer (~38 days) are slightly longer than last year.
-
Sale-to-list ratio just under 99.5%.
Takeaway: more compact, high-price-per-foot units driving the stats; fewer giant over-ask bidding wars, but still a competitive environment.
Jamaica Plain (21 sales, reliable)
-
Activity eased from October but remains up year-over-year.
-
Average price (~$840K) is up low-single digits from October and about 12% YoY.
-
Price per sqft (~$644) is roughly flat vs last year.
-
Days to offer in the low 40s, similar to a year ago, with sale-to-list right around 100%.
Takeaway: JP remains a steady, mid-upper price point condo market with balanced but competitive conditions.
East Boston (13 sales, reliable)
-
Sales pulled back from October and last year.
-
But average price (~$703K) is up ~9% MoM and modestly YoY, and price per sqft (~$729) is up strongly vs last year.
-
Days to offer in the low-20s, a bit faster than October.
-
Sale-to-list just over 98%.
Takeaway: fewer buyers than last year, but those in the market are paying more for well-located, renovated units.
Brighton (17 sales, reliable)
-
Slight uptick in sales vs October and strong YoY volume.
-
Average price (~$655K) is basically flat YoY; price per sqft (~$712) is also nearly flat vs last year.
-
Days to offer just under 30 days, materially better than the very long marketing times a year ago.
-
Sale-to-list is just over 100.5%.
Takeaway: Brighton looks competitive and fairly priced, with stable values and quicker sales.
Softer or thin-sample downtown segments
Back Bay (19 sales – reliable volume, but volatile)
-
Sales are down vs both October and last year.
-
Average price (~$1.72M) is down ~31% MoM and ~24% YoY, and price per sqft (~$1,354) is also down high-single digits.
-
Days to offer are high (around 69 days), though better than October’s ~86.
-
Sale-to-list ratio holds around 96%.
Takeaway: still a very expensive market, but buyers have more time and negotiating room than a year ago.
Beacon Hill, Bay Village, Leather District, The Fenway, Chestnut Hill (Boston)
-
Each of these submarkets had fewer than 8 condo sales in November – in some cases just 1–3 closings – which is too thin to declare a trend.
-
Prices in individual deals can swing dramatically (for example Bay Village and Leather District), and the percentage changes you see in the table are almost entirely driven by mix rather than broad market shifts.
Talking point: “Small downtown condo submarkets saw very limited activity in November, so month-to-month price jumps there are mostly about which particular units happened to sell.”
West Roxbury & Hyde Park
-
West Roxbury had 4 sales and Hyde Park 1 sale, so data there is also thin.
-
West Roxbury shows much slower marketing times (over 70 days on average) and lower prices than a year ago, but again, with so few sales, treat that as directional only.
North Shore & near-North markets
Among the Essex County and nearby coastal markets:
-
Beverly (9 sales, reliable)
-
Sales surged from a single closing in October to 9 in November, with average price (~$517K) down sharply from October’s spike but up ~15% vs last year.
-
Sale-to-list ratio slightly above 101%.
-
Takeaway: Beverly’s condo segment looks healthy and slightly competitive, with November reflecting more normal pricing after one very expensive October closing.
-
-
Salem (21 sales, reliable)
-
Volume pulled back ~40% vs October but is up slightly YoY.
-
Average price (~$578K) and price per sqft (~$439) are both up mid-single digits vs last November.
-
Days to offer stretched into the high 30s, up vs last year, but sale-to-list stays close to 97%.
-
Takeaway: steady demand, but buyers are taking a bit more time.
-
-
Revere (17 sales, reliable)
-
Very strong YoY volume growth (nearly double last year’s closings), but:
-
Average price (~$441K) is down around 10% MoM and YoY.
-
Price per sqft (~$409) is also lower.
-
-
Days to offer jumped into the 50-day range and sale-to-list eased just under 98.5%.
-
Takeaway: more options and more time for buyers in Revere; sellers are still getting close to asking but not the premiums seen previously.
-
-
Lynn (11 sales, reliable)
-
Sales are off roughly 27% YoY and down vs October.
-
Price is flat vs last year, but price per sqft and sale-to-list ratio have both slipped, and days to offer are roughly triple last November.
-
Takeaway: Lynn shows some of the clearest signs of a cooling, more negotiable condo market.
-
-
Saugus, Marblehead, Swampscott, Peabody
-
Each of these had 5 or fewer sales in November; trends are directional only.
-
Marblehead and Swampscott, especially, are driven by a tiny handful of closings, so be cautious with any strong statements about price direction.
-
Inner-ring suburbs: Arlington, Watertown, Waltham, Quincy & friends
Arlington (14 sales, reliable)
-
Stable volume vs October, slightly higher vs last year.
-
Average price (~$1.02M) is up mid-teens MoM and high-teens YoY, while price per sqft actually dipped vs both periods.
-
Days to offer are under 3 weeks, and sale-to-list just under 99%.
Takeaway: buyers are paying more overall for Arlington condos, but not dramatically more per foot – larger or higher-amenity units are trading.
Watertown (14 sales, reliable)
-
Sales flat vs last November.
-
Average price (~$747K) is down vs October but up modestly YoY; price per sqft is up mid-single digits YoY.
-
Days to offer in the mid-30s, slower than last year but faster than October, with sale-to-list ratio just under 99%.
Takeaway: steady demand, modest appreciation, but less frenzy than last year (fewer over-ask outcomes).
Waltham (10 sales, reliable)
-
Sales down sharply from October’s 22 closings, but actually higher than last year.
-
Average price (~$692K) is up vs October but down almost 10% YoY, while price per sqft is higher than last year.
-
Days to offer roughly doubled vs October to over 40 days.
-
Sale-to-list ratio eased slightly under 98.5%.
Takeaway: Waltham is a slower, more price-sensitive market than a year ago, but not distressed.
Quincy (21 sales, reliable)
-
Volume dipped modestly vs both October and last November.
-
Average price (~$574K) is up about 8% MoM but down ~5% YoY.
-
Price per sqft (~$488) is up both month-over-month and year-over-year.
-
Days to offer in the mid-20s (faster than October), sale-to-list just under 99%.
Takeaway: Quincy condos remain fundamentally strong, with buyers paying more per foot even as the average ticket price looks softer vs last year.
Other inner-ring suburbs (Belmont, Lexington, Medford, Malden, Milton, Needham, Wellesley, etc.)
-
Many of these had fewer than 8 sales in November, which makes the percentage moves unreliable.
-
Broadly:
-
Belmont, Milton, Wellesley show very high average prices with only a handful of sales – classic “thin luxury” submarkets.
-
Medford, Malden had small samples but generally show stable to slightly softer pricing and more modest competition than during peak pandemic years.
-