Two of Boston’s most transit-rich, walkable urban neighborhoods. Both built on dense triple-decker stock and rapid condo conversion. Both drew the same buyer profile for a decade. February through May 2026, they moved in opposite directions.
$1.52M−1%
Median Price
$1.06M−17%
$698+7%
Avg $/sq.ft.
$597−14%
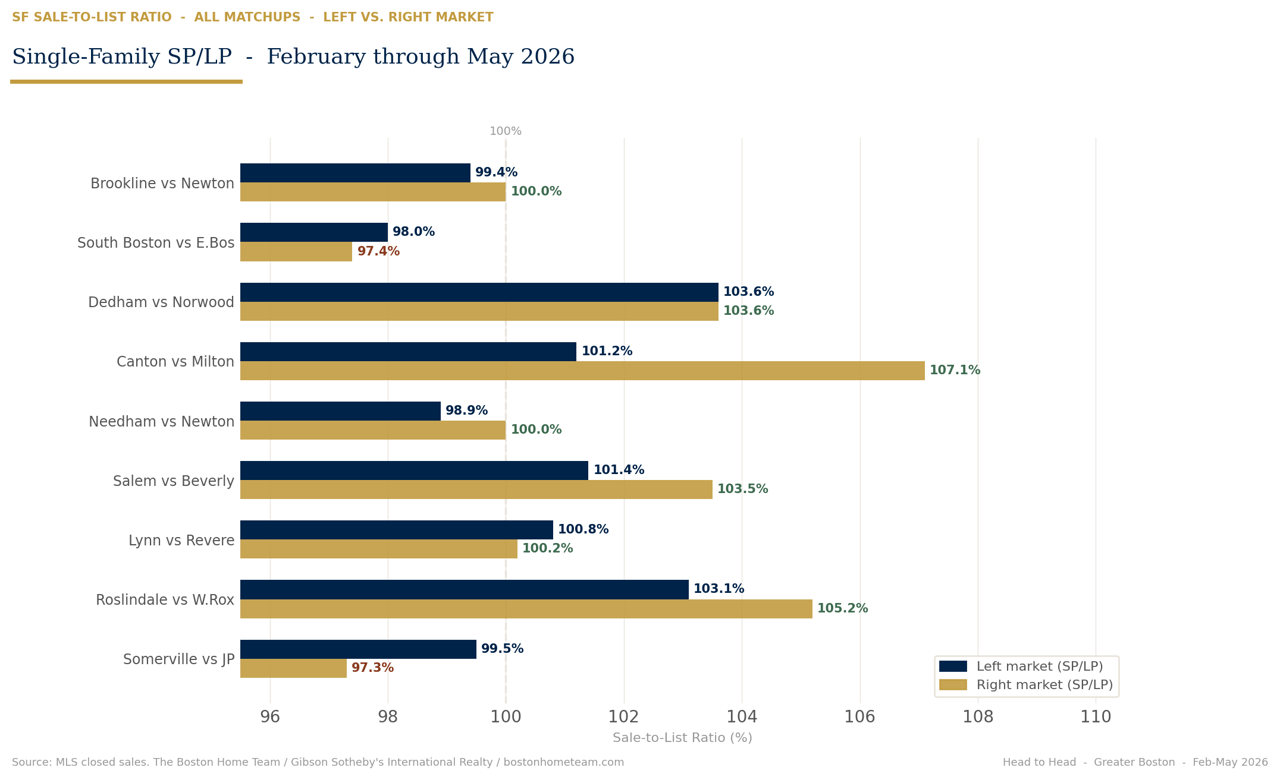
99.5%(was 100.0%)
SP/LP
97.3%(was 105.1%)
7dunchanged
Days to Offer
14d+7.5d
Condo Somerville n=128 · JP n=88 — strong sample both
Matchup 02 of 10 · Feb–May 2026 vs. 2025
Separated by a handful of blocks and connected by the VFW Parkway. Roslindale is the more affordable entry point; West Roxbury the established family destination. Both SF markets are active — but one is gaining ground on the other at a notable clip.
Single-Family
Condo ⚠ West Roxbury CC median dropped 20.5% — confirmed mix effect ($/sq.ft. only −7%). Not a price collapse.
Multi-Family ⚠ West Roxbury n=3 — insufficient for trend. Roslindale n=9, treat with caution.
Matchup 03 of 10 · Feb–May 2026 vs. 2025
The North Shore’s two highest-volume entry-point markets. Similar price bands, similar buyer profile. Revere’s SF market is surging while Lynn’s is contracting. Their condo markets told the opposite story.
Single-FamilyLynn n=81 · Revere n=33 — both reliable
CondoLynn n=47 · Revere n=40
Matchup 04 of 10 · Feb–May 2026 vs. 2025
Adjacent commuter rail markets with similar buyer demographics but different vibes. Beverly’s SF market is outperforming on price and SP/LP. Salem’s multi-family market is doing something strange.
Single-FamilySalem n=39 · Beverly n=51
CondoSalem n=73 · Beverly n=25
Multi-Family ⚠ Salem MF SP/LP collapsed from 106.7% to 95.4% as volume surged +56%. Beverly n=7 — use caution.
Matchup 05 of 10 · Feb–May 2026 vs. 2025
The western suburbs’ most direct rivalry. Newton carries the bigger price tag; Needham often punches above its weight on SP/LP. Both showed softness in SF through February–May 2026. The condo round is closer than you’d expect.
Single-FamilyNeedham n=76 · Newton n=131 — both high confidence
Condo ⚠ Needham CC median +23% but $/sq.ft. only +2% — mix effect. Not a uniform price jump.
Matchup 06 of 10 · Feb–May 2026 vs. 2025
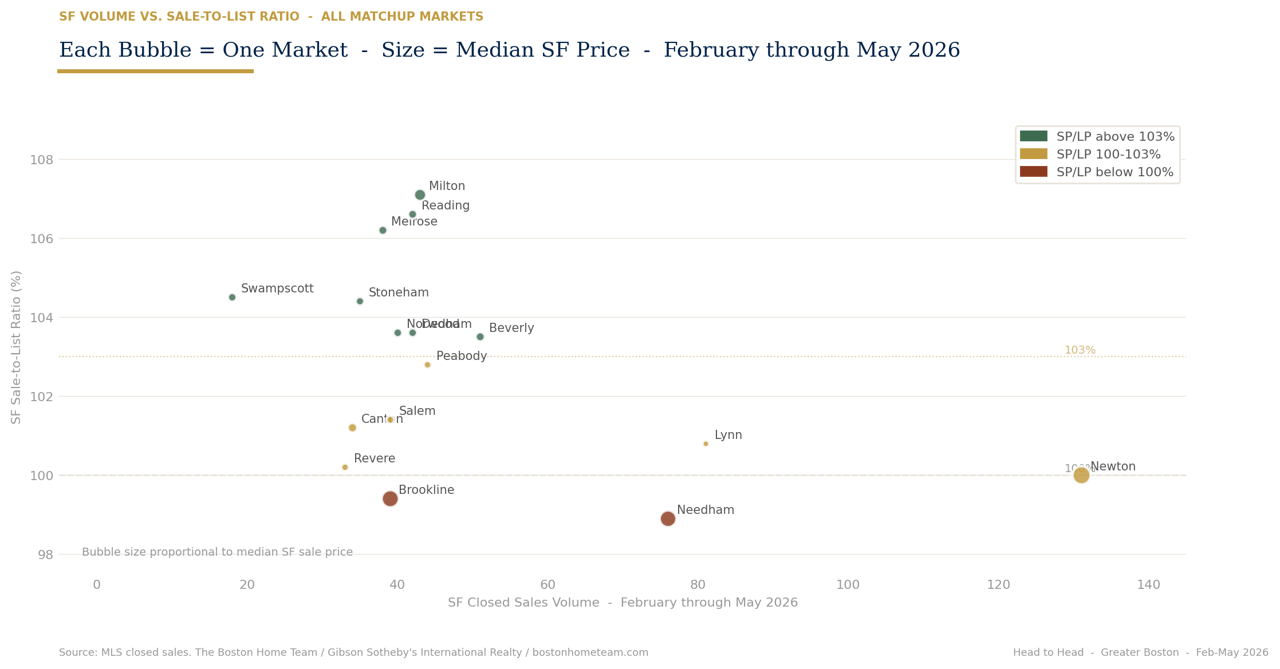
Two of the southeast suburbs’ most desirable markets. Through February–May 2026, Milton’s SF market posted the highest SP/LP of any coverage market in Greater Boston. Canton’s condo market more than doubled in volume over the same period.
Single-Family ⚠ Milton SF median +23% YoY but $/sq.ft. down 3% — confirmed mix effect on price. SP/LP is real.
CondoCanton n=37 (+118% YoY) · Milton n=12
Matchup 07 of 10 · Feb–May 2026 vs. 2025
The closest fight on the card. These two Route 1 corridor towns share a price band, a buyer profile, and — as it turns out — nearly identical SF sale-to-list ratios. On the SF tape, five basis points separates them. The condo story is where they diverge sharply.
Single-FamilyDedham n=42 · Norwood n=40 — well-matched sample sizes
Condo ⚠ Dedham CC volume collapsed 53% (34→16). Norwood CC grew 17%. Same price point, opposite trajectories.
Matchup 08 of 10 · Feb–May 2026 vs. 2025
Boston’s two waterfront-adjacent urban condo markets. Both underwent rapid gentrification in the 2010s; both are now digesting that run-up. Neither market is firing on all cylinders through May. The question is which is softer — and both have a credible claim to that title.
CondoSouth Boston n=96 · East Boston n=93 — high volume, reliable
Single-Family ⚠ South Boston n=10 · East Boston n=13 — small, treat carefully
Matchup 09 of 10 · Feb–May 2026 vs. 2025
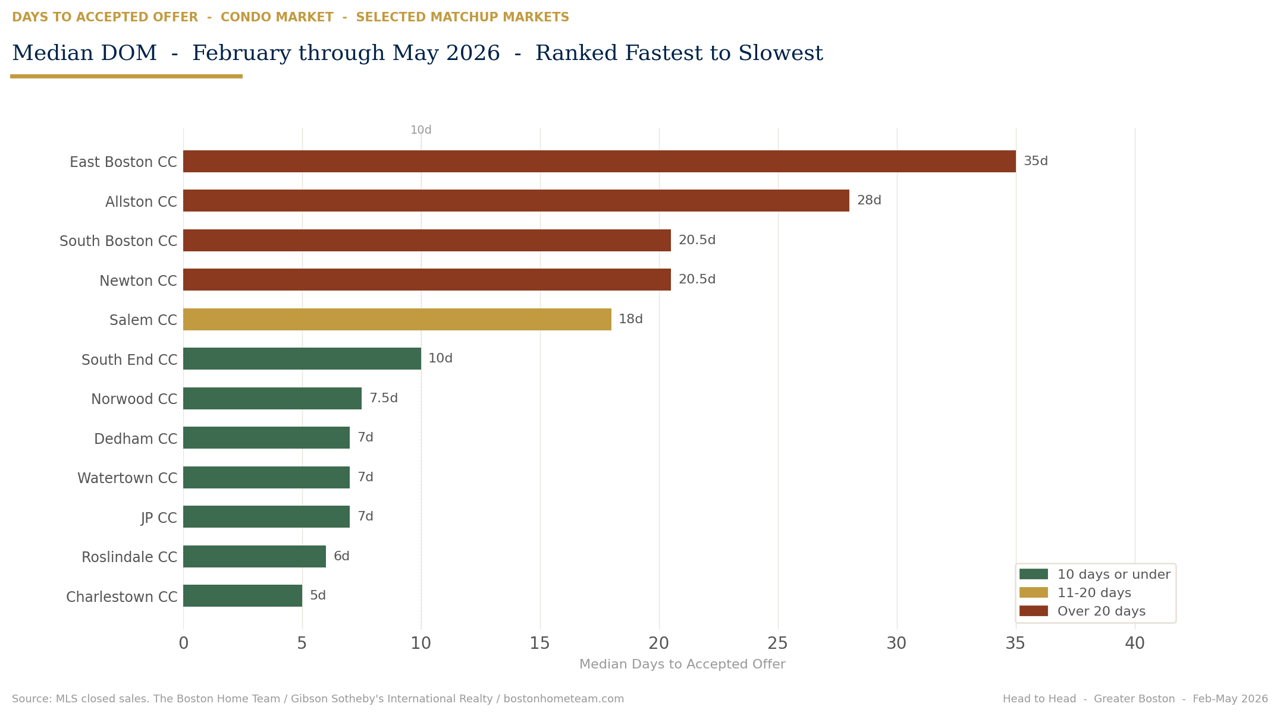
Boston’s two most boutique premium urban neighborhoods. South End carries the higher price per square foot; Charlestown offers more volume and a distinct townhouse market. Charlestown condos are moving in 5 days at 100% of asking. South End is a different story.
CondoCharlestown n=57 · South End n=82 — both reliable
Single-Family ⚠ Charlestown n=9 · South End n=3 — both too thin for trend analysis. CC is the primary market in both neighborhoods.
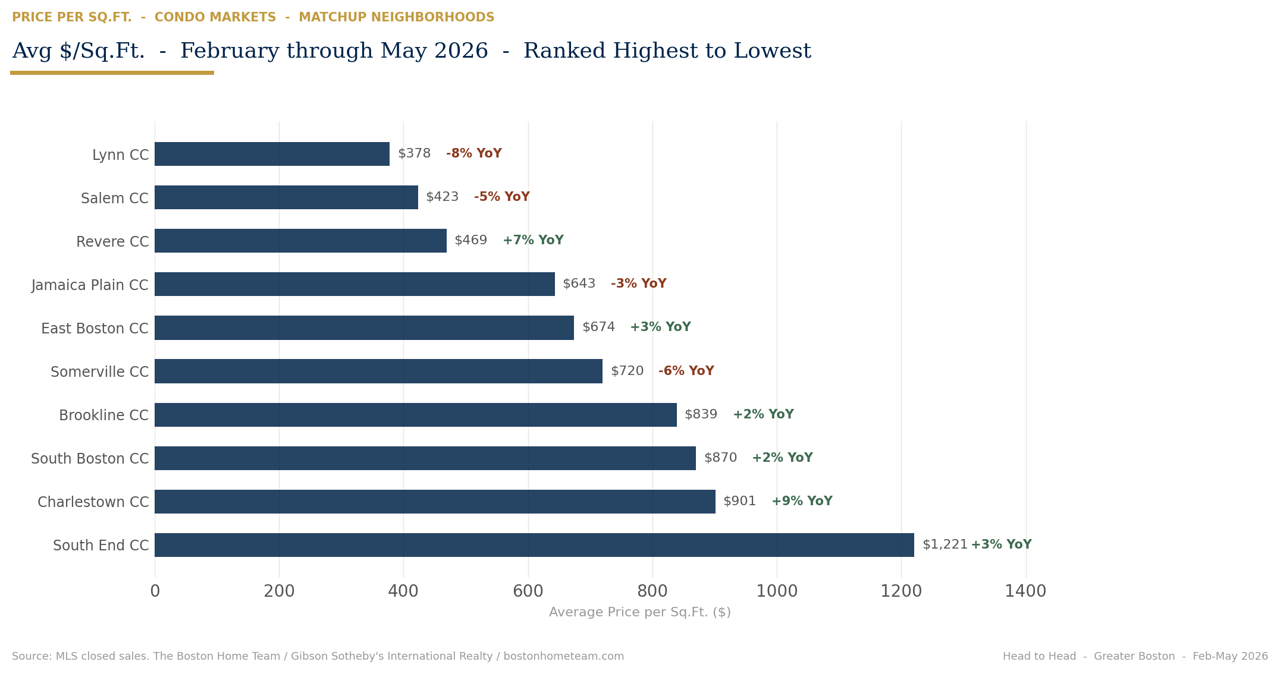
VerdictCharlestown wins on momentum. Volume up 8% while South End fell 15%. SP/LP at exactly 100% with 5-day DOM is one of the tightest condo readings in urban Boston. South End retains a significant $/sq.ft. premium ($1,221 vs. $901) and higher median price — but it’s selling slower, below asking, and on declining volume. If you’re buying condos, Charlestown is the more liquid market right now.