Leave a Message

By providing your contact information to The Boston Home Team, your personal information will be processed in accordance with The Boston Home Team's Privacy Policy. By checking the box(es) below, you consent to receive communications regarding your real estate inquiries and related marketing and promotional updates in the manner selected by you. For SMS text messages, message frequency varies. Message and data rates may apply. You may opt out of receiving further communications from The Boston Home Team at any time. To opt out of receiving SMS text messages, reply STOP to unsubscribe.

Thank you for your message. We will be in touch with you shortly.

Greater Boston Market Round Up  (Feb-May 2026)

Greater Boston Market Round Up (Feb-May 2026)

 
Market Report · Greater Boston · 24 Coverage Markets · February–May 2026
 

The Spring That Split in Two


Four months into the 2026 spring selling season, the pattern is clear. Single-families fell. Condos held. Multi-family quietly moved. This isn’t one market story — it’s three, running simultaneously across the same geography.

Closed Sales · MLS Data · February–May 2026 vs. 2025 and 2024 · Published June 2026

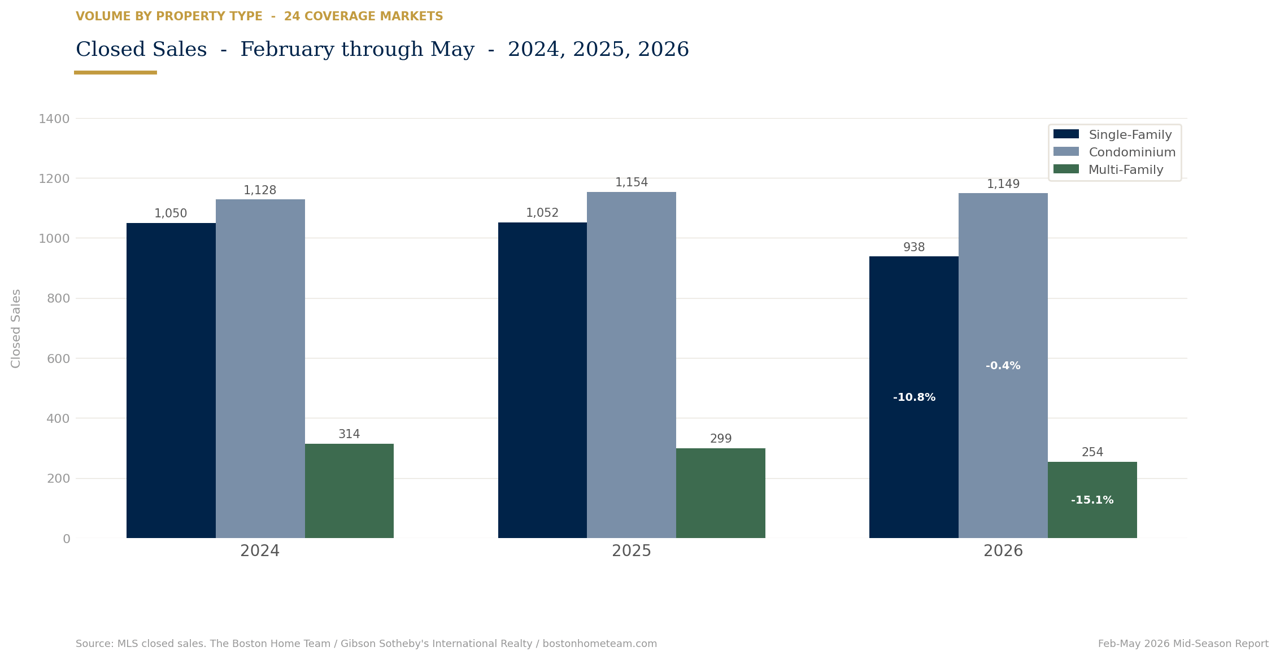
The two-track story that defined late 2025 is now an established pattern. Across 24 coverage markets — from Jamaica Plain and Cambridge through the North Shore — single-family volume has fallen roughly 11% year over year through May, and the decline holds almost identically against 2024 (-10.7%). This is not a one-year wobble. It’s a two-year compression of SF transaction activity that’s showing no sign of reversal in the February–May data.

Condos are the counterweight. 1,149 CC transactions across coverage markets through May, essentially flat year over year and slightly above 2024 levels. In the markets where SF demand has dried up, condo volume has often expanded — buyers adjusting to price reality rather than exiting entirely. Multi-family is falling from a different angle: rate sensitivity among investor-buyers and tighter lending are compressing MF activity at a steeper rate than even SF.

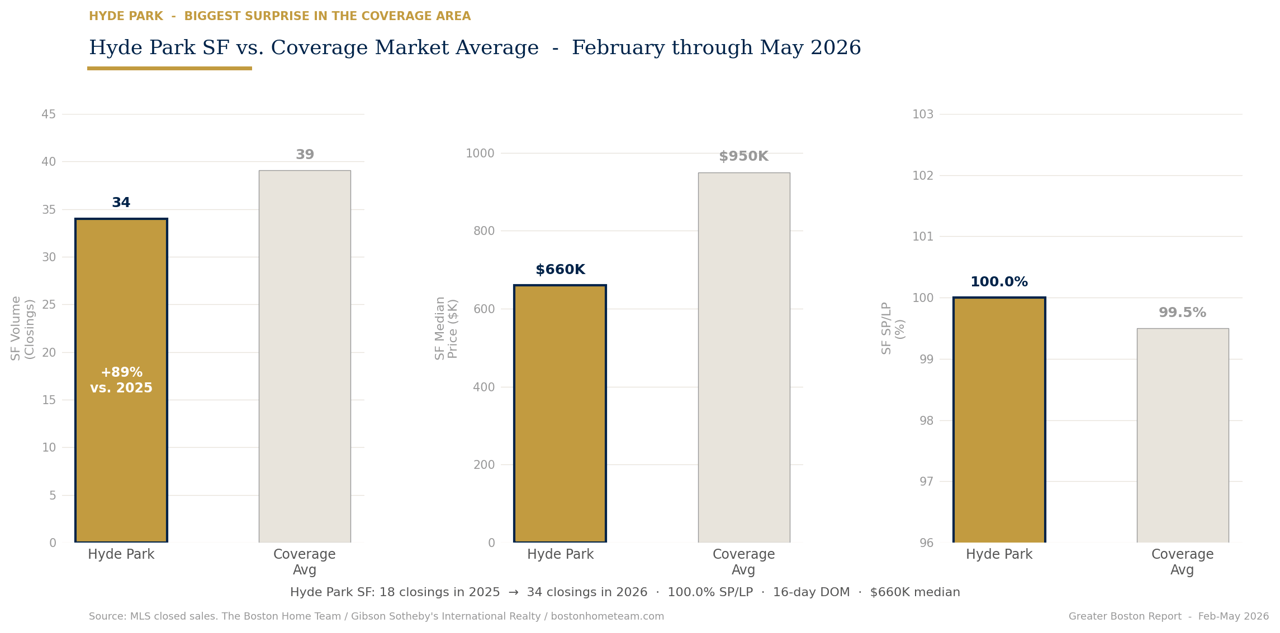
The divergence is not uniform. Several coverage markets are outperforming sharply. A few have broken down across all three metrics simultaneously. And one market — Hyde Park — is doing something that no other primary coverage market is doing through the first four months of the selling season.


24 coverage markets · February–May 2024–2026

Type
2024
2025
2026
YoY Change
SF
 
1,050
2024 baseline
 
1,052
flat from ’24
 
938
2026
−10.8% YoY
−10.7% vs ’24
CC
 
1,128
2024 baseline
 
1,154
+2.3% from ’24
 
1,149
2026
−0.4% YoY
+1.9% vs ’24
MF
 
314
2024 baseline
 
299
−4.8% from ’24
 
254
2026
−15.1% YoY
−19.1% vs ’24


Four markets that broke from the pattern

Biggest Surprise · Primary Core
Hyde Park
SF Volume ’25 → ’2618 → 34 (+89%)
CC Volume YoY16 → 19 (+19%)
SF Median Price$660K
SF SP/LP100.0%
SF DOM16 days
Steepest Drop · Coverage Market
Allston
CC Volume ’25 → ’2633 → 17 (−48%)
CC DOM YoY9 → 28 days (+19d)
CC SP/LP97.7%
vs. 2025 SP/LP100.0%
All 3 distress flags✓ Vol ✓ DOM ✓ SP/LP
Inner-Ring Resilience
Cambridge + Watertown
Cambridge SF28 → 31 (+11%)
Cambridge CC150 → 156 (+4%)
Watertown CC68 → 80 (+18%) · 7d DOM
Cambridge SF SP/LP102.0%
Cambridge MF14 → 18 (+29%)
Highest SP/LP in Coverage Area
Milton
SF SP/LP107.1%
SF DOM6 days
SF Median Price$1.2M
SF Median vs. ’25+$225K (+23%)
Mix effect flag⚠ See note below
Mix effect disclosure — Milton SF and Cambridge CC: Milton SF median price jumped 23% year over year ($970K → $1.2M), but $/sq.ft. moved only marginally ($540 → $523, actually down 3%). This pattern — large median move with flat $/sq.ft. — is a mix effect: higher-end homes made up a larger share of what sold, not a uniform appreciation in value. Similarly, Cambridge CC median fell 14% ($1.106M → $951K) while $/sq.ft. rose 2%. Different homes traded in 2026 than in 2025. Neither figure should be read as a simple market-wide price change.


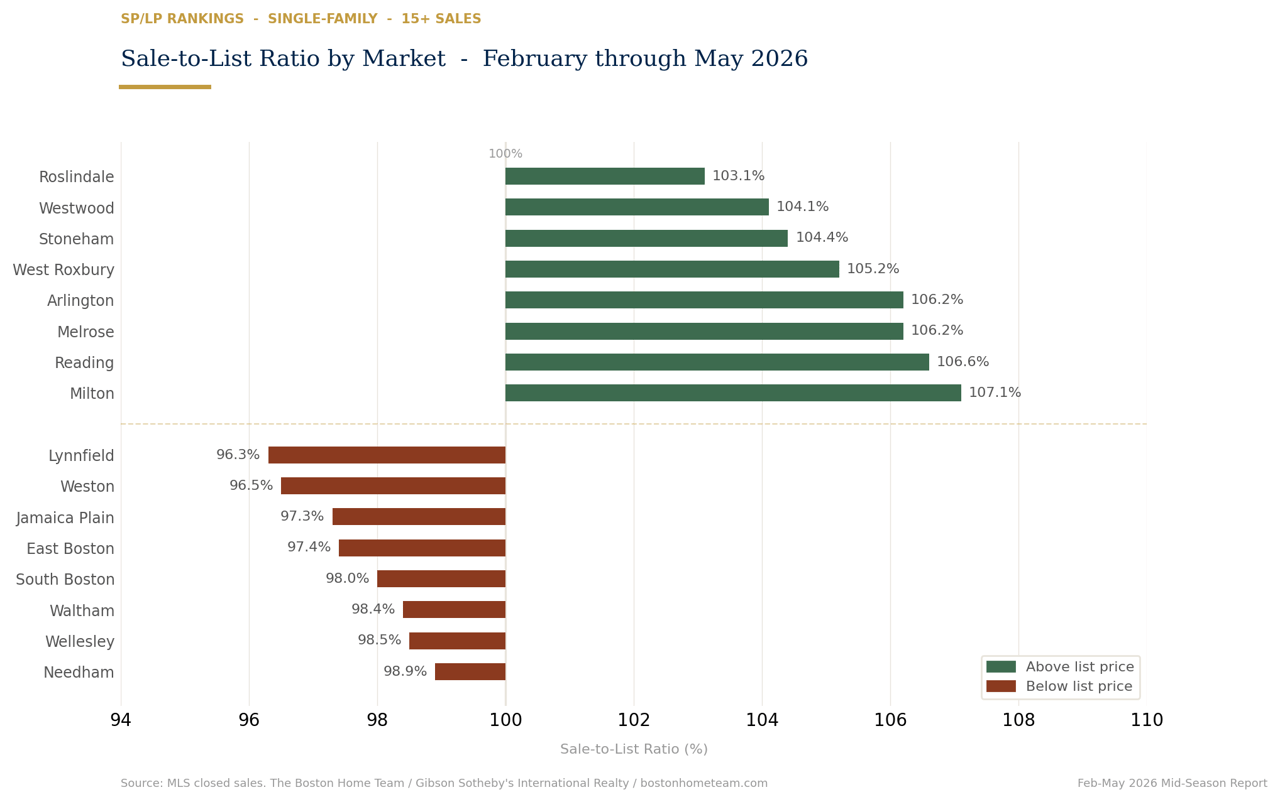
Markets with 15+ sales · Feb–May 2026

 
Highest Sale-to-List
#1Milton
 
107.1%
#2Reading
 
106.6%
#3Melrose
 
106.2%
#4Arlington
 
106.2%
#5West Roxbury
 
105.2%
#6Stoneham
 
104.4%
#7Westwood
 
104.1%
#8Roslindale
 
103.1%
 
Lowest Sale-to-List
Lynnfield
 
96.3%
Weston
 
96.5%
Jamaica Plain
 
97.3%
East Boston
 
97.4%
South Boston
 
98.0%
Waltham
 
98.4%
Wellesley
 
98.5%
Needham
 
98.9%
What the SP/LP list reveals: The markets beating list price by 5%+ all share a profile — sub-$1.1M median, under 8 days DOM, suburban or near-suburban location with strong school districts. The markets below list price fall into two camps: high-end luxury (Weston, Wellesley, Needham, where negotiation is structurally built in) and markets experiencing genuine softness (Jamaica Plain SF, East Boston SF, South Boston SF). Those are different problems requiring different strategies.
107.1%
Milton SF Sale-to-List Ratio — highest in the coverage area

Six-day median DOM. $1.2M median price. A mix-effect caveat applies to the YoY price jump, but the competitive pressure is real: Milton SF buyers are paying over ask quickly, and have been for two straight years.


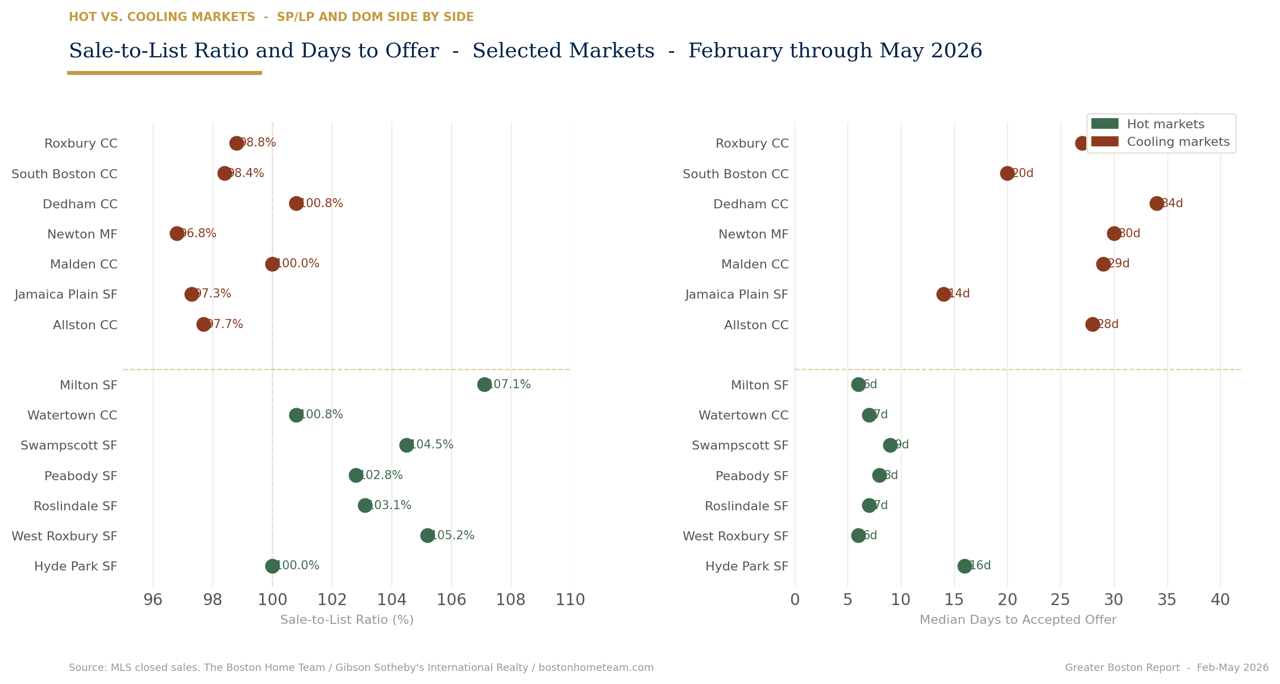
Markets moving sharply in either direction

▲ Hot Markets
Hyde Park SF
+89% vol · 100% SP/LP · $663K median
West Roxbury SF
105.2% SP/LP · 6-day DOM · $571/sq.ft.
Roslindale (SF + CC)
Both types up in vol · 103.1% SF SP/LP
Peabody (SF + CC)
SF +27% · CC +150% vol · 102.8% SF SP/LP
Swampscott
SF +47% · CC +46% vol · across-the-board surge
Watertown CC
+18% vol · 7-day DOM · tightest condo market in the corridor
Milton SF
107.1% SP/LP · 6-day DOM (mix-effect caveat on price)
▼ Cooling Markets
Allston CC
−48% vol · 28-day DOM · 97.7% SP/LP · all 3 flags
Jamaica Plain SF
−25% vol · 14-day DOM · 97.3% SP/LP · −7.8pp YoY
Malden CC
−39% vol · 29-day DOM · 100% SP/LP holding
Newton MF
−30% vol · 30-day DOM · 96.8% SP/LP · all 3 flags
Dedham CC
−53% vol · 8 → 34 days DOM · 100.8% SP/LP holding
South Boston CC
−32% vol · 10 → 20.5-day DOM · 98.4% SP/LP
Roxbury CC
−29% vol · 27-day DOM · 98.8% SP/LP · softening


The stealth story inside a declining headline number

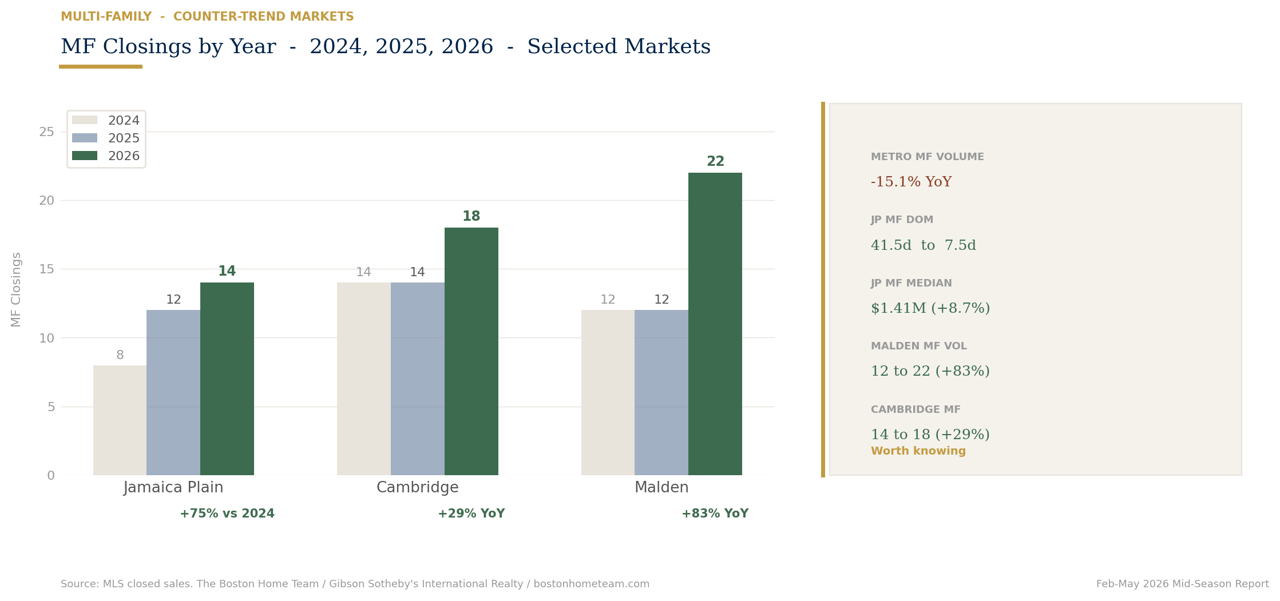
The multi-family headline at the metro level is declining volume — down 15% across coverage markets. But within that decline, a handful of specific markets are quietly running counter-trend, with MF volume and pricing that tell a different story than the SF data in the same zip codes.

Jamaica Plain
+75%
Vol growth vs. ’24
8 → 14 closings · $1.41M med
Cambridge
+29%
Vol growth YoY
14 → 18 closings · $2.1M med
Malden
+83%
Vol growth YoY
12 → 22 closings · $995K med
Medford
107.2%
SF SP/LP while MF holds 7.5-day DOM

The JP multi-family resurgence is the most notable in the corridor. MF volume has more than doubled from its 2024 base (8 → 14 closings through May), DOM has tightened dramatically (41.5 days in 2024 to 7.5 days now), and median price is $1.41M — up 8.7% year over year. This is a market segment that was struggling two years ago and has found its footing, driven in part by buyers seeking owner-occupied two-families as an alternative to the softening SF market at similar price points.

Malden’s MF surge (12 → 22 closings, +83%) and Cambridge MF growth (+29%) both confirm the pattern: in higher-cost markets where buyer purchasing power has been stretched, the two-to-four family is serving as a creative entry point for buyers who can offset mortgage costs with rental income.


A market reorganization, not a market downturn

The read: Greater Boston is not in a market downturn. It’s in a market reorganization — buyers and capital flowing toward segments that work (condos, select SF pockets, emerging MF markets) and away from segments where seller expectations haven’t yet caught up with buyer reality. The markets that are soft are soft for reasons that can be addressed. The markets that are strong are strong because the fundamentals are intact.
“In the markets where SF demand has dried up, condo volume has often expanded — buyers adjusting to price reality rather than exiting entirely.”
 
About This Report
BJ Ray · The Boston Home Team

This report covers 24 Greater Boston markets — including Jamaica Plain, West Roxbury, Hyde Park, Roslindale, Allston, South Boston, East Boston, Cambridge, Watertown, Milton, Newton, Needham, Wellesley, Westwood, Waltham, Dedham, Malden, Medford, Arlington, Reading, Melrose, Stoneham, Swampscott, Peabody, and Lynnfield — using closed MLS sales data from February through May 2026, compared against the same period in 2025 and 2024. Markets with fewer than 5 transactions in any period are excluded from trend analysis. This report is part of an ongoing series tracking real estate conditions across Greater Boston published each season by The Boston Home Team at Gibson Sotheby’s International Realty. BJ Ray has tracked Greater Boston real estate data across these markets for 21 years.

Data note: All figures reflect closed MLS sales, February–May 2026, compared against the same period in 2025 and 2024. This report is published in June 2026 as a mid-season snapshot covering four months of the spring selling season. Coverage markets include 24 primary, secondary, and North Shore areas tracked by The Boston Home Team. Markets with fewer than 5 transactions in any period are excluded from trend analysis. Mix effects (median price movement not confirmed by $/sq.ft. movement) are disclosed in narrative. SP/LP = sale-price-to-list-price ratio. DOM = days to accepted offer. All comparisons are closed-sales only; no pending, active, or off-market data is included. Three-condition distress flags require simultaneous: volume decline >10% YoY, DOM increase >5 days, SP/LP erosion >1 percentage point. This report is informational only.
Work With Us
Know which side of this market you’re on.

24 markets. Three property types. One team that tracks all of it. If you’re trying to understand what the spring 2026 data means for your specific situation — buying, selling, or deciding whether to move at all — that’s the conversation we’re built for.

Greater Boston Market Round Up  (Feb-May 2026)

Partner With Local Experts

At the Boston Home Team, we combine local expertise with personalized service to guide you through every step of your real estate journey. Whether you’re buying, selling, or investing, our knowledge of the Boston market gives you a competitive advantage.

Follow Us on Instagram